Figure 5.1
Balanced Approach to aircraft noise management
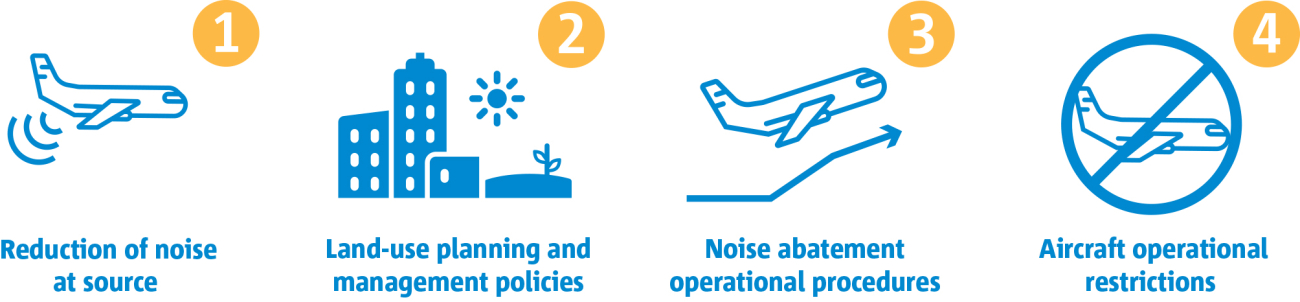
Figure 5.2
Share of operations by cumulative margin to Chapter 3 limits at EU27+EFTA airports
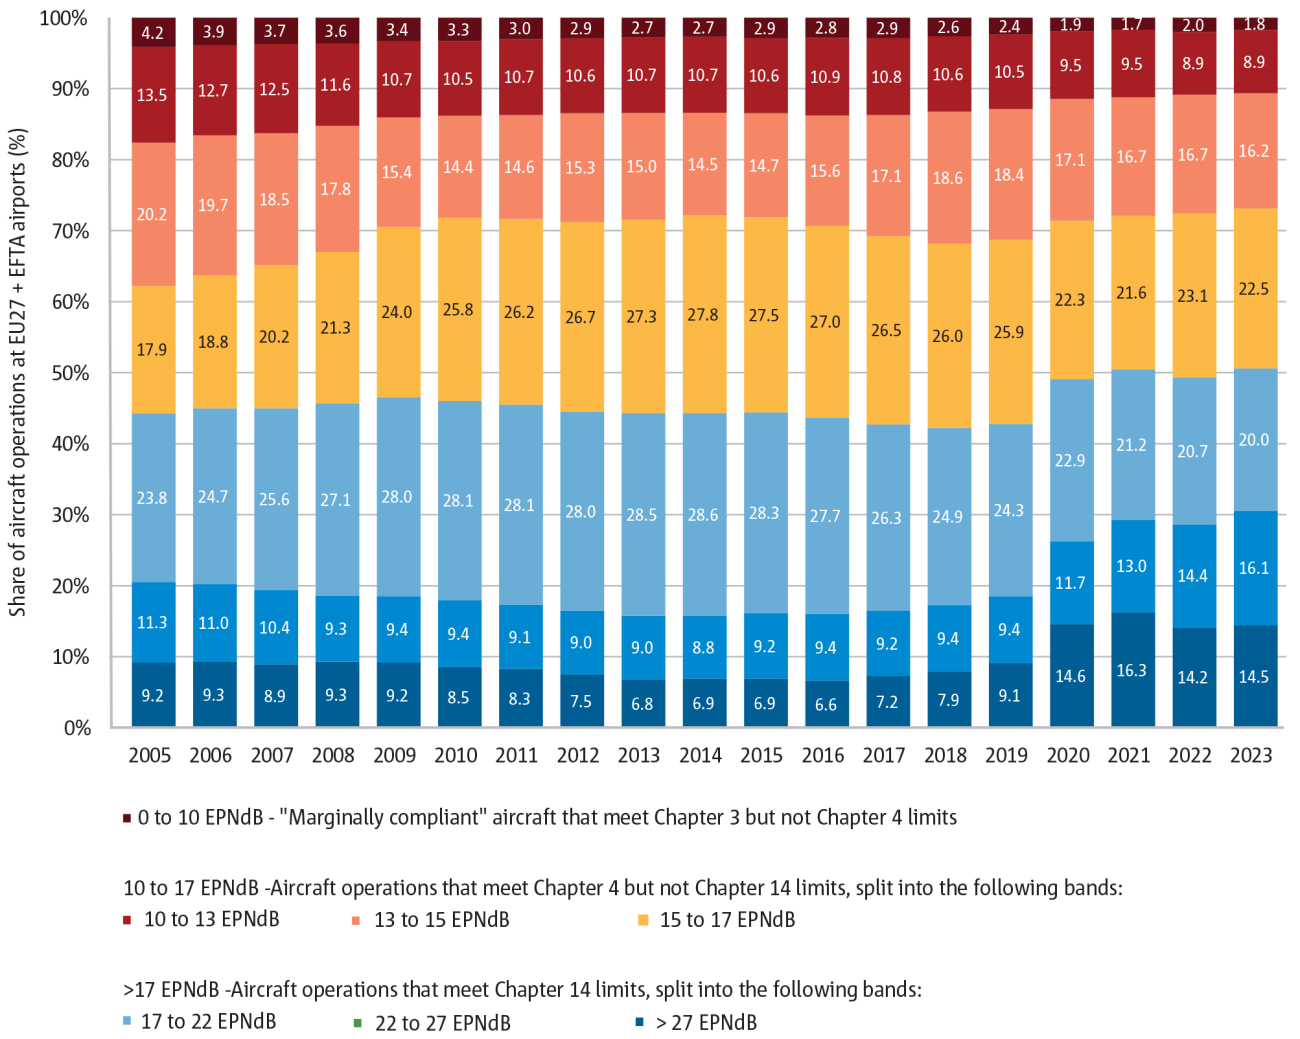
Figure 5.3
Example of the difference between NADP 1 and 2 for a wide body aircraft with thrust reduction at 1 000ft.
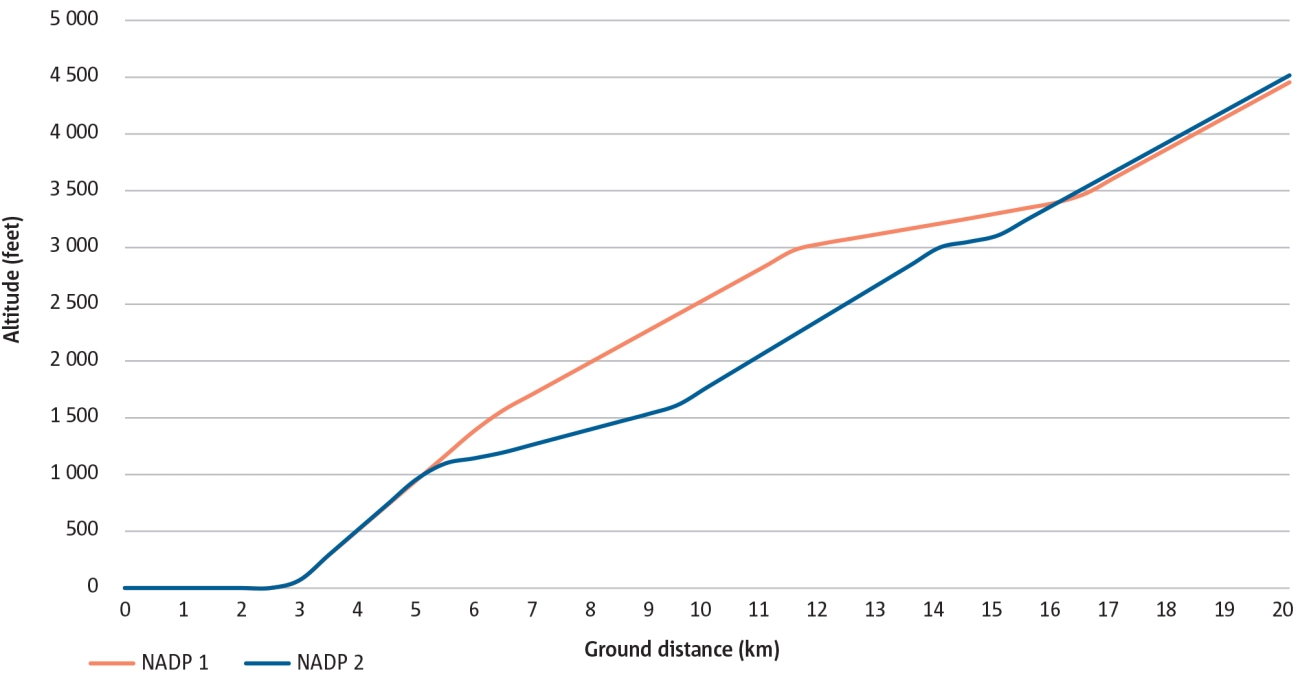
Table 5.1
Overview of airport initiatives to support the uptake of SAF
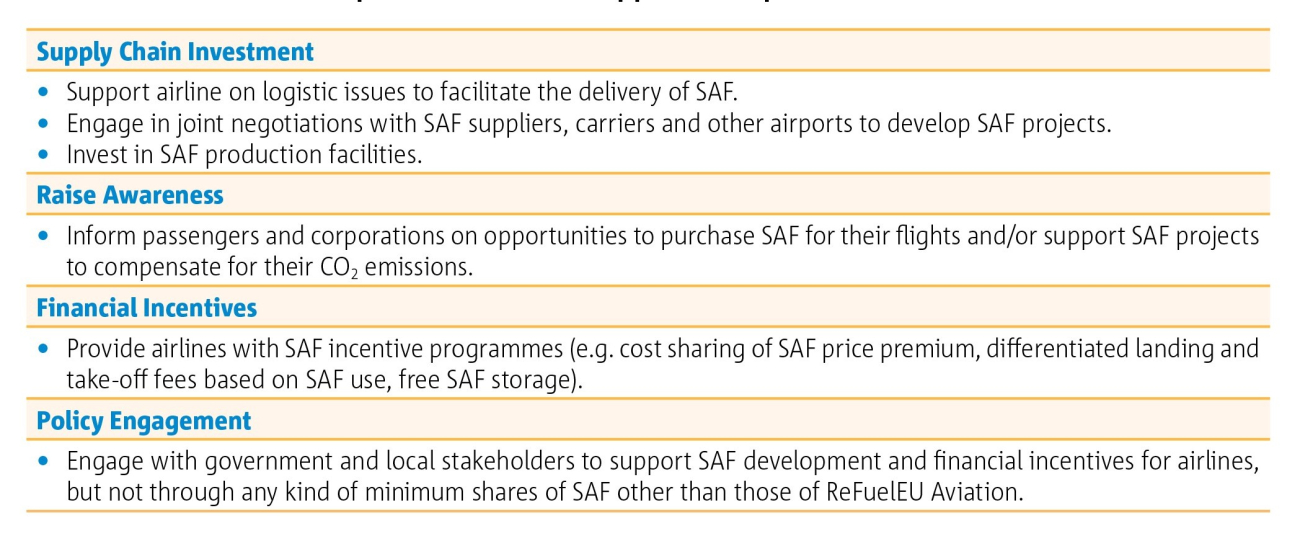
Figure 5.4
European airports participating in the ACA programme
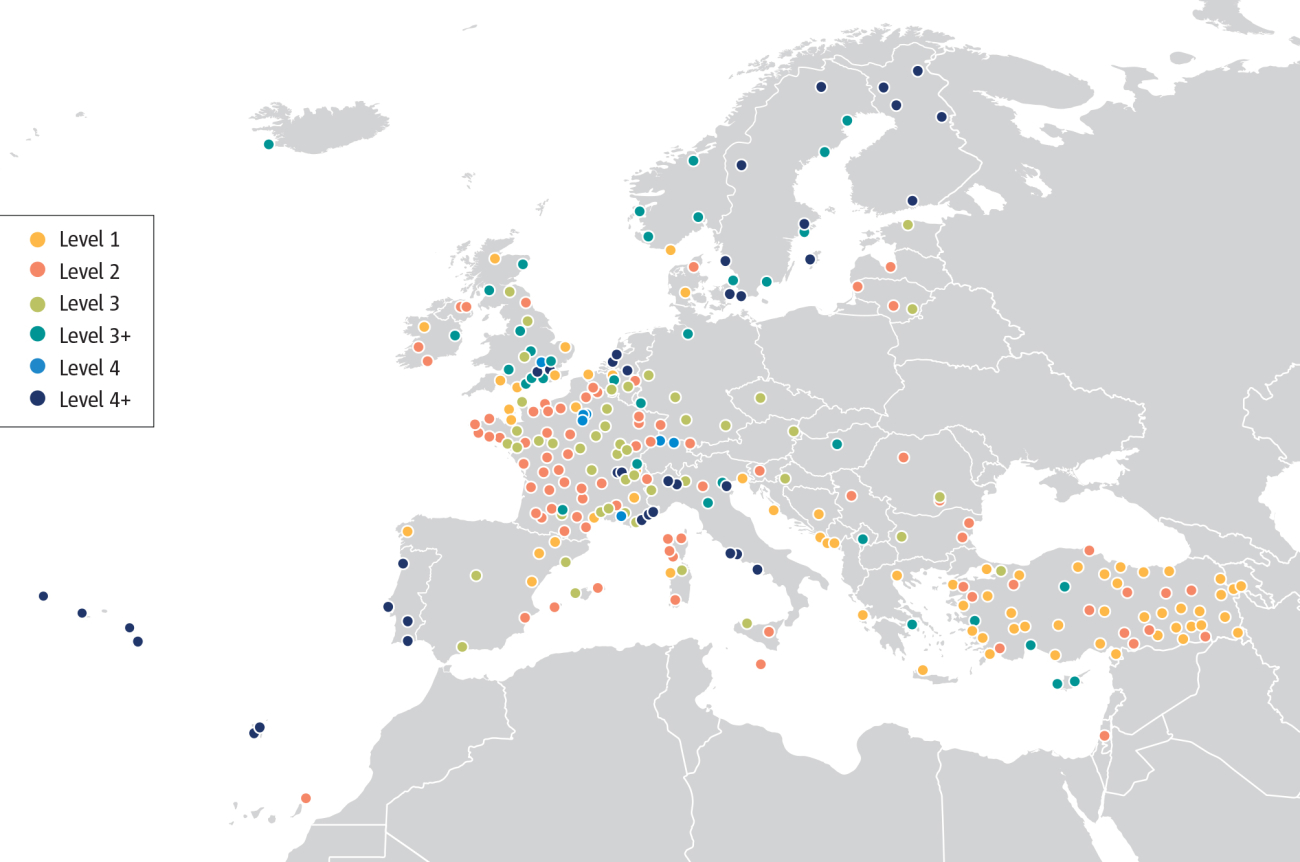
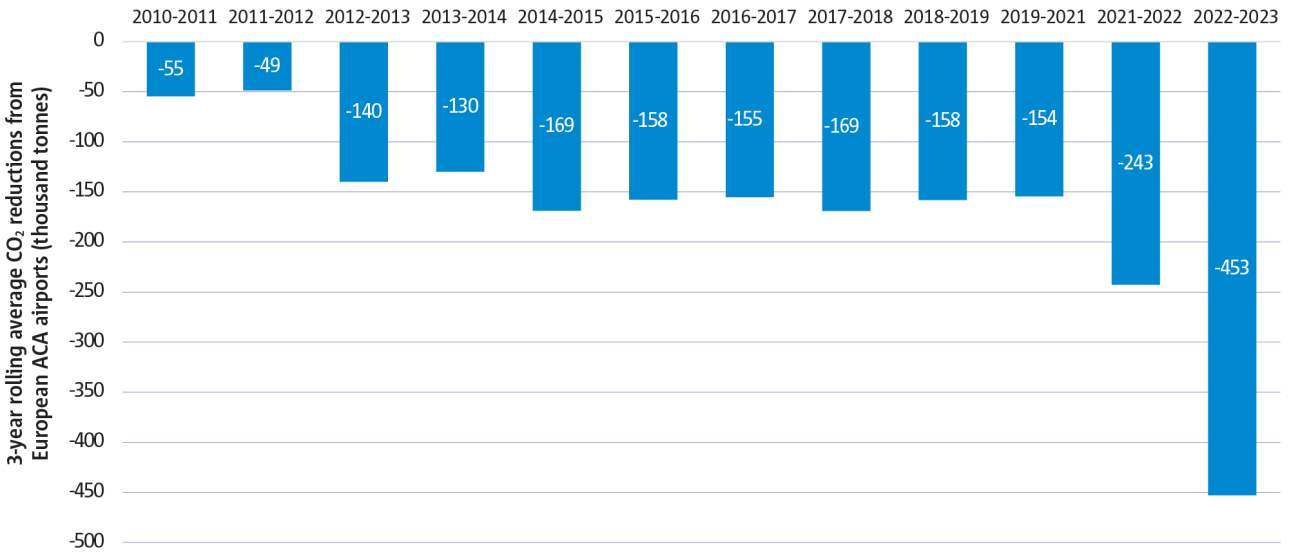
Figure 5.5
Increasing number of accredited European airports as well as increasing CO2 emissions per passenger since 2019-2021

Figure 5.6
Scope 1 and 2 emissions reductions in airport CO2 emission