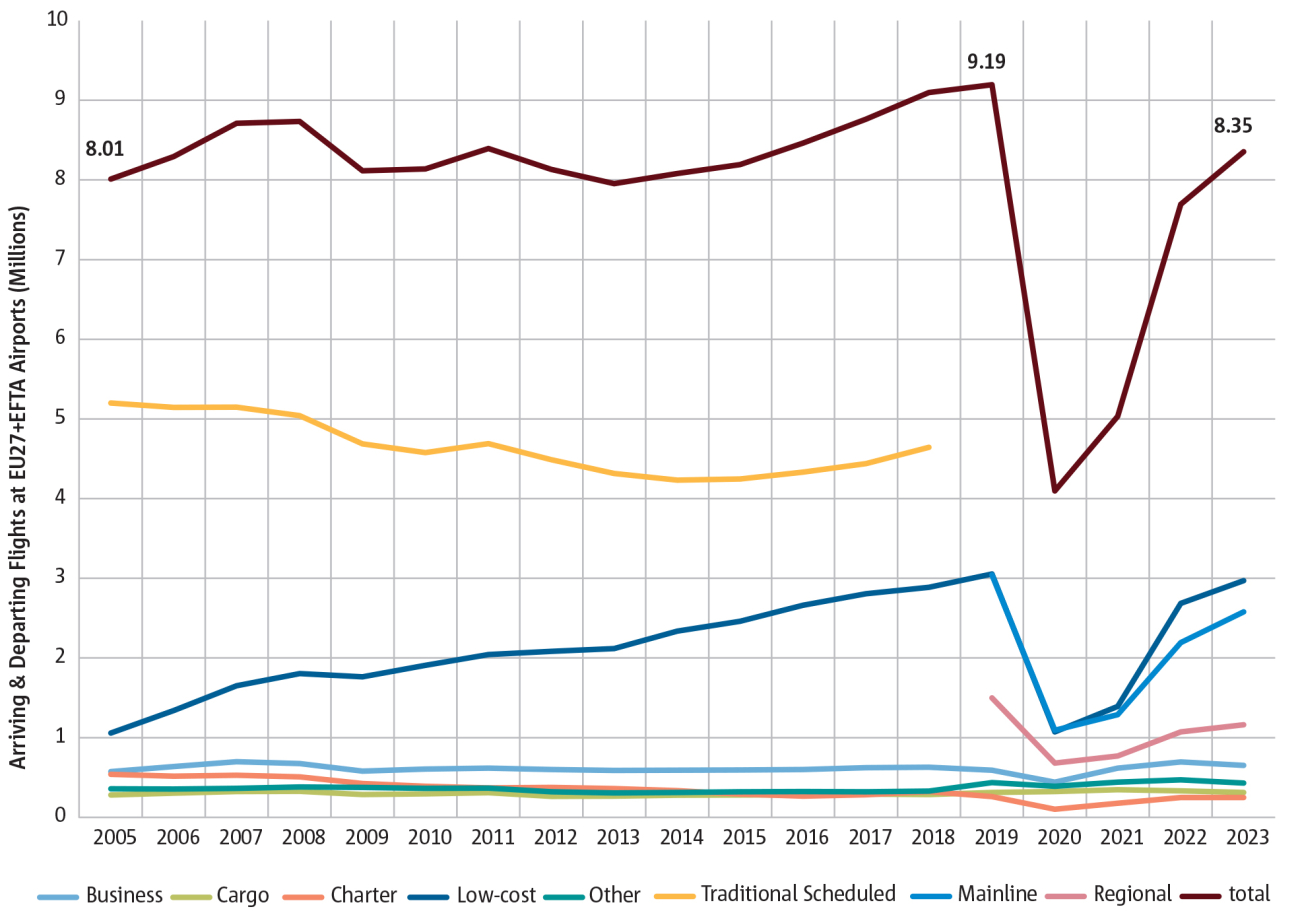
Figure 1.1
Low-cost recovered faster from COVID than mainline carriers
![Low-cost recovered faster from COVID than mainline carriers](/sites/default/files/styles/max_1300x1300/public/migrated_eaer_images/figure-1-1.png?itok=sjRWa2Zi)
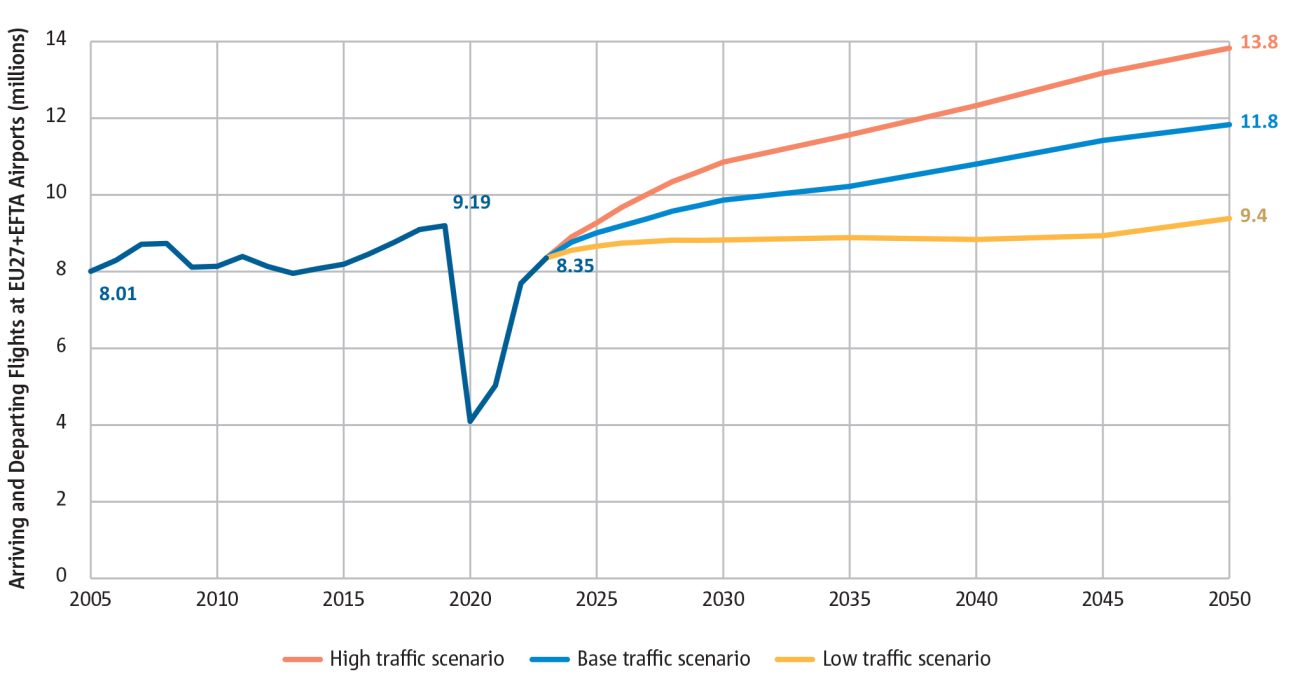
Figure 1.2
Annual flights could exceed 10 million shortly after 2030
![Annual flights could exceed 10 million shortly after 2030](/sites/default/files/styles/max_1300x1300/public/migrated_eaer_images/figure-1-2.png?itok=aLN7g-S6)
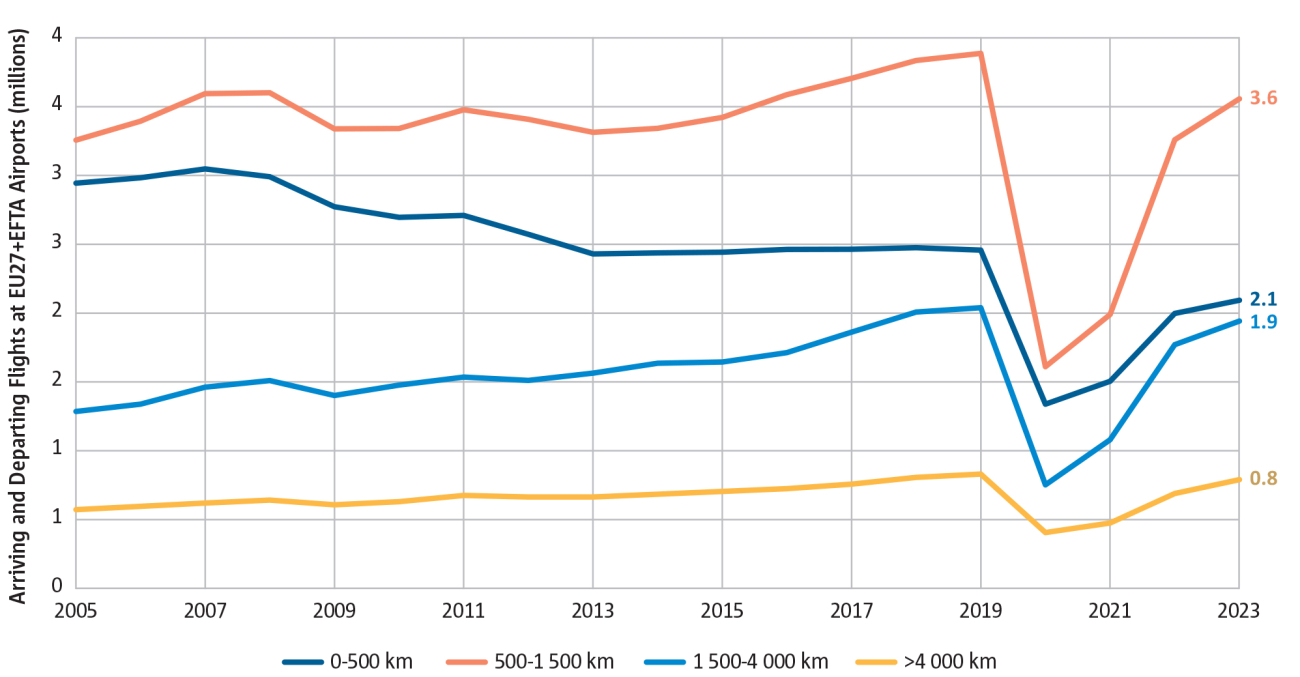
Figure 1.3
Very short-haul flights show the slowest recovery after COVID crisis
![Very short-haul flights show the slowest recovery after COVID crisis](/sites/default/files/styles/max_1300x1300/public/migrated_eaer_images/figure-1-3.png?itok=EDYK1Etn)
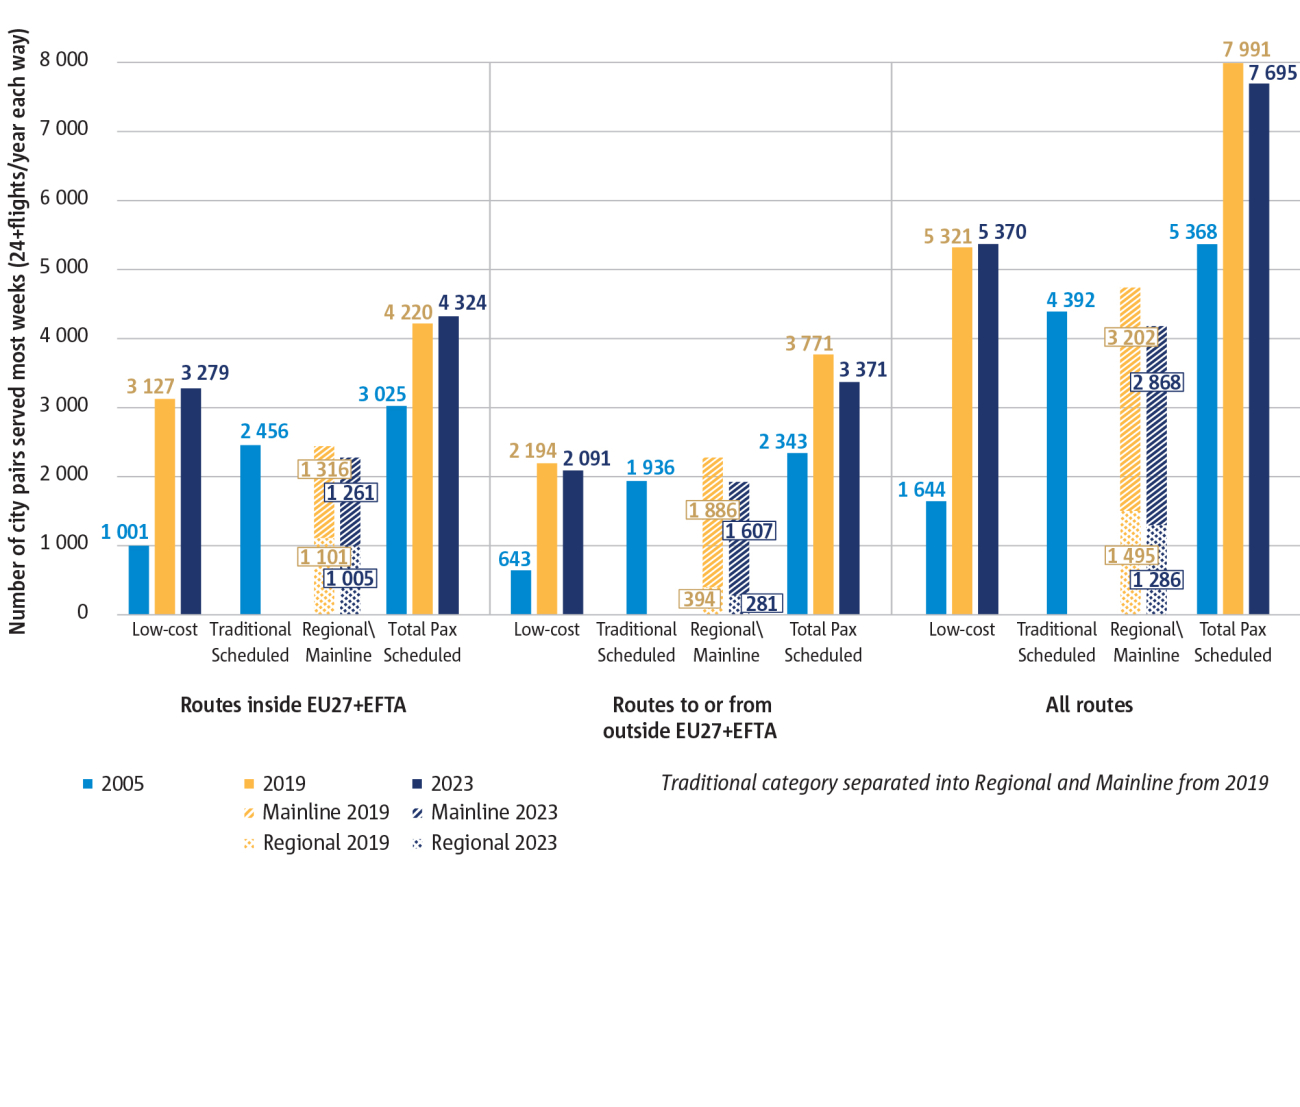
Figure 1.4
Extra-European connectivity recovering slower than intra-European after COVID
![Extra-European connectivity recovering slower than intra-European after COVID](/sites/default/files/styles/max_1300x1300/public/migrated_eaer_images/figure-1-4.png?itok=mXev05hU)
Figure 1.5
Fleet continues to age slowly for most carrier categories
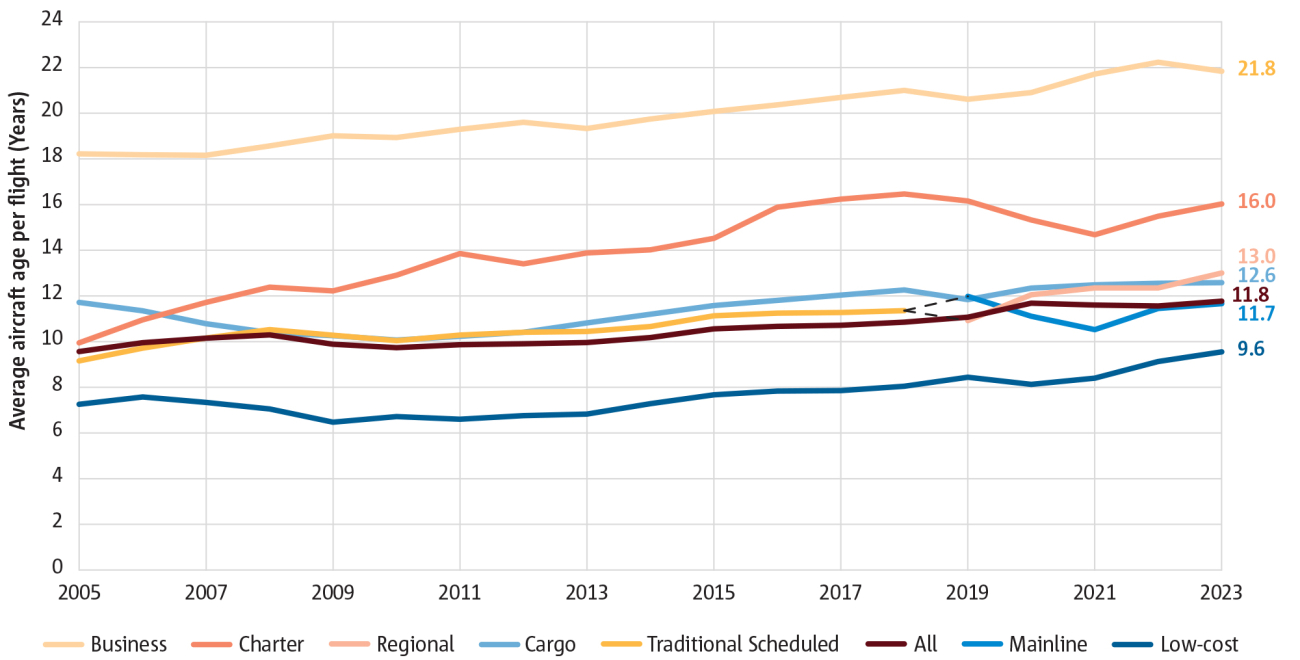
![Fleet continues to age slowly for most carrier categories](/sites/default/files/styles/max_1300x1300/public/migrated_eaer_images/figure-1-5.png?itok=V2HfQoH_)
Figure 1.6(a)
The number of night flights is still below 2019 level but their share of total flights is higher
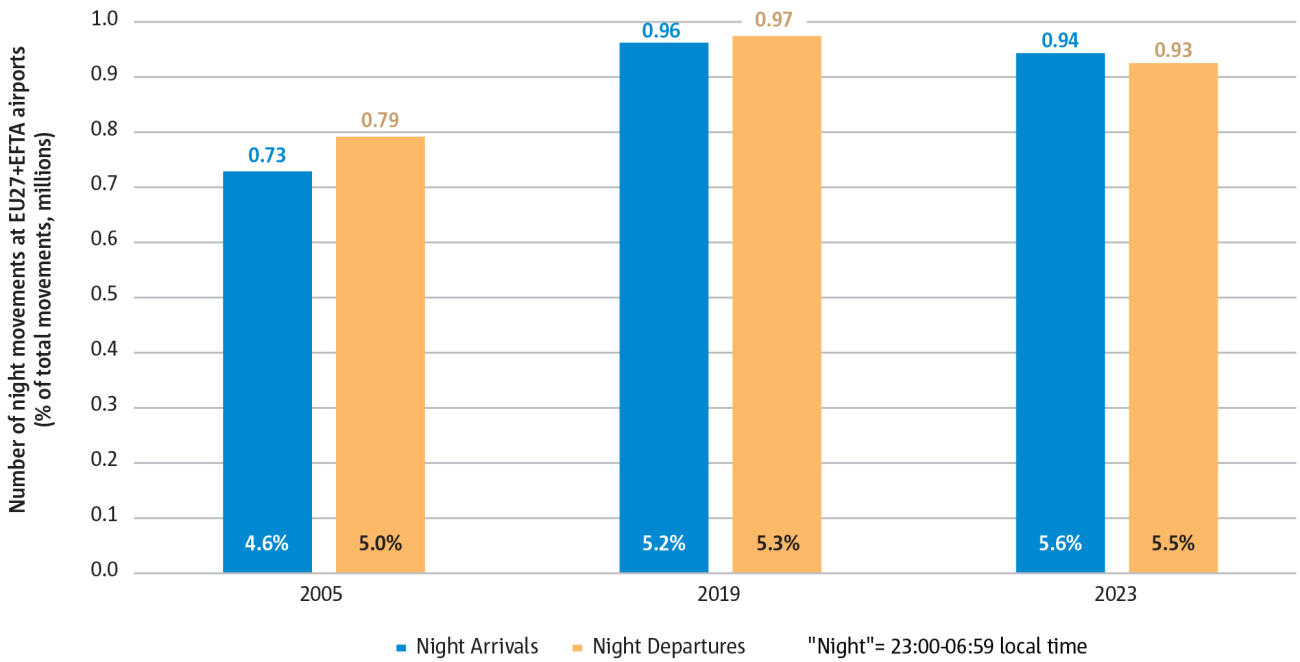
![The number of night flights is still below 2019 level but their share of total flights is higher](/sites/default/files/styles/max_1300x1300/public/migrated_eaer_images/figure-1-6a.png?itok=XB4RodCJ)
Figure 1.6(b)
Airport traffic peaks just before and after the night period
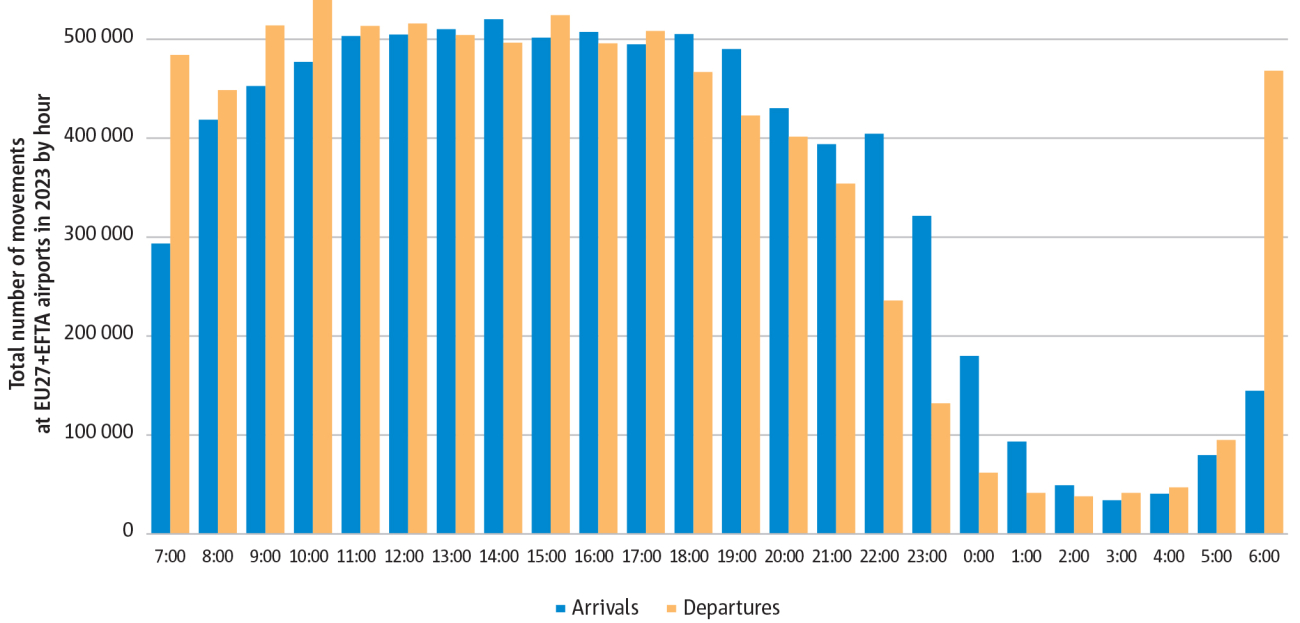
![Airport traffic peaks just before and after the night period](/sites/default/files/styles/max_1300x1300/public/migrated_eaer_images/figure-1-6b.png?itok=_kPFFN3U)
Figure 1.7
Summary of air traffic indicators (% change to 2005)
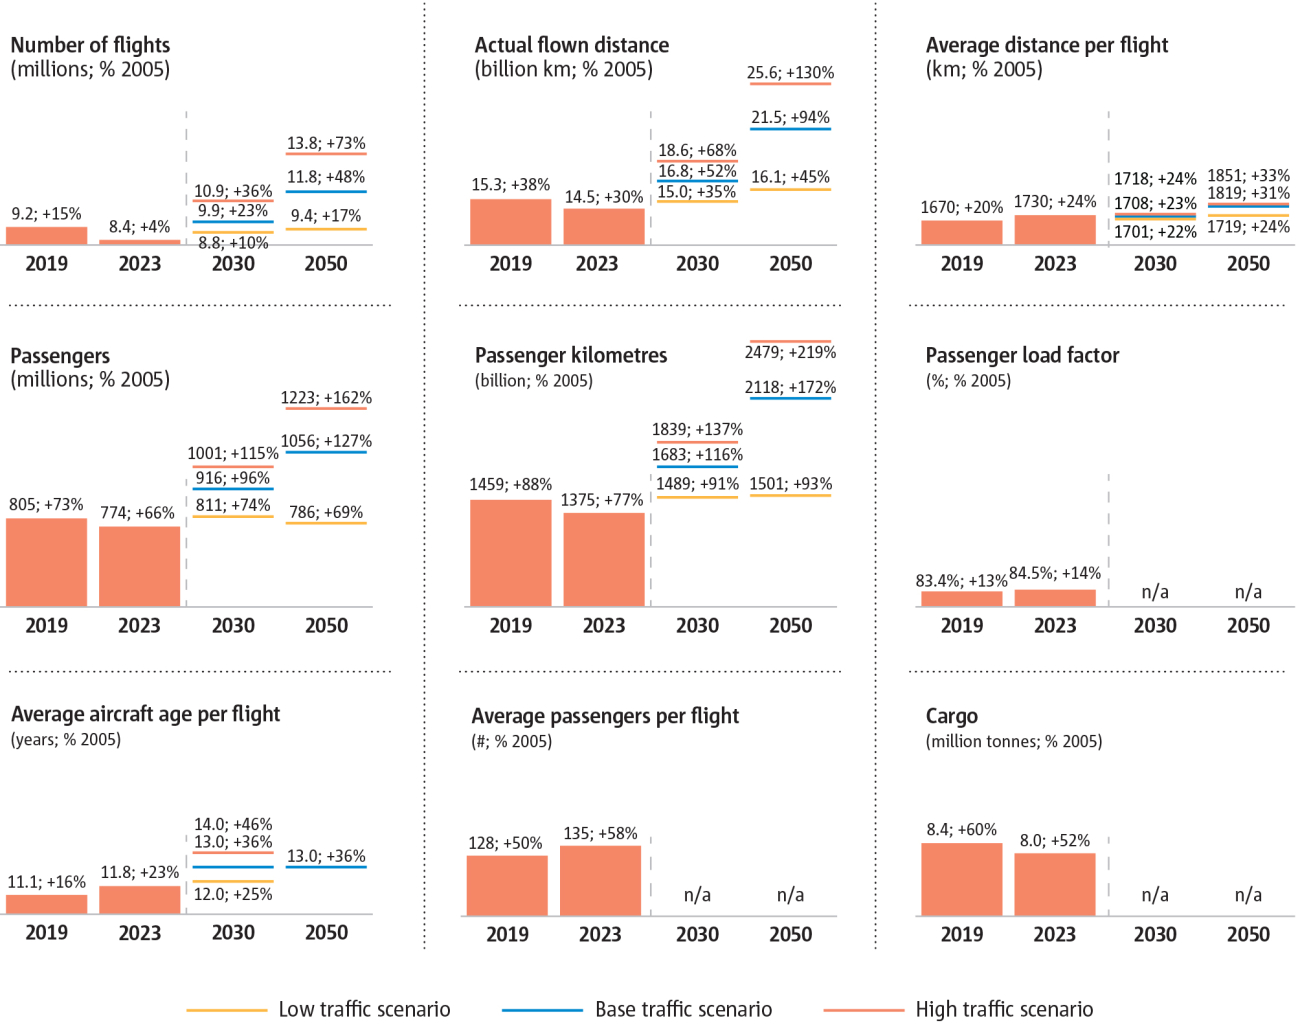
![Summary of air traffic indicators (% change to 2005)](/sites/default/files/styles/max_1300x1300/public/migrated_eaer_images/figure-1-7.png?itok=cemIxfN3)
Figure 1.8
Total Lden dB population around major airports may stay below pre-COVID level
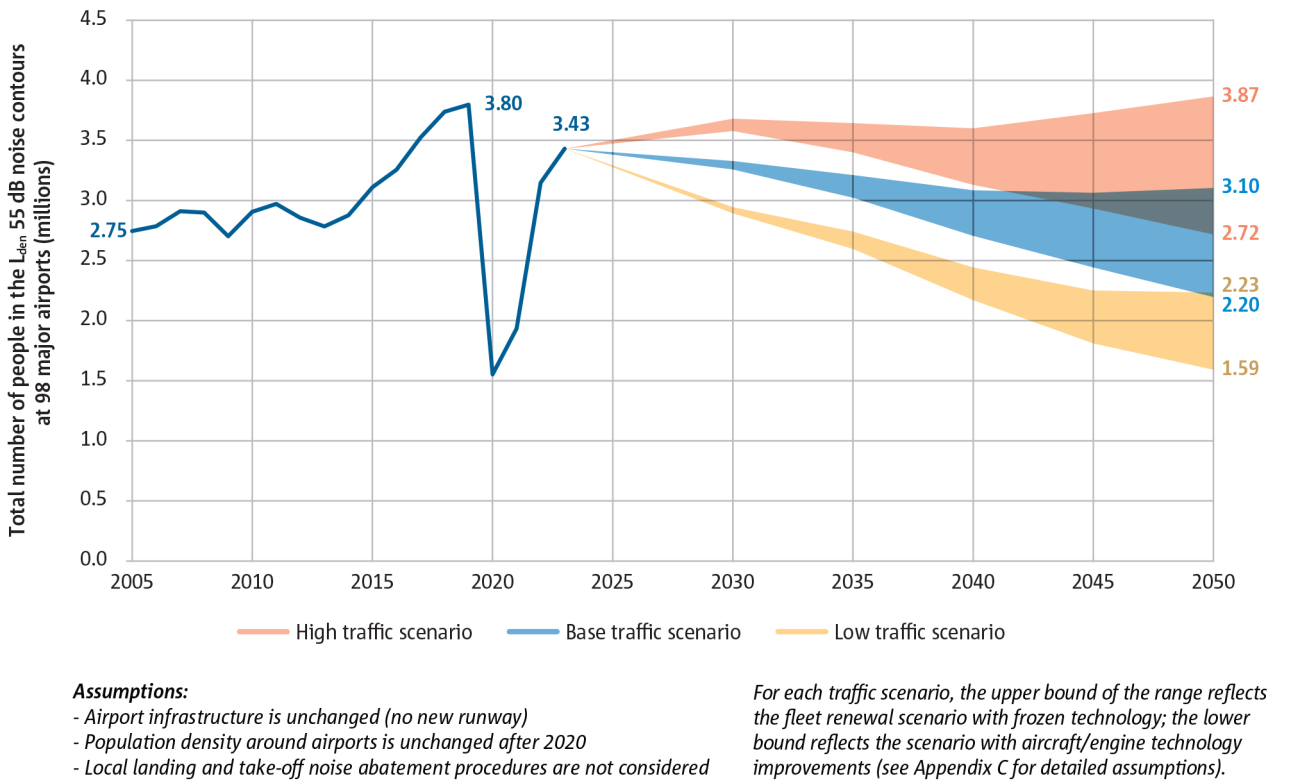
![Total L<sub>den</sub> dB population around major airports may stay below pre-COVID level](/sites/default/files/styles/max_1300x1300/public/migrated_eaer_images/figure-1-8.png?itok=6lBKivRq)
Figure 1.9
Summary of noise indicators (% change to 2005)
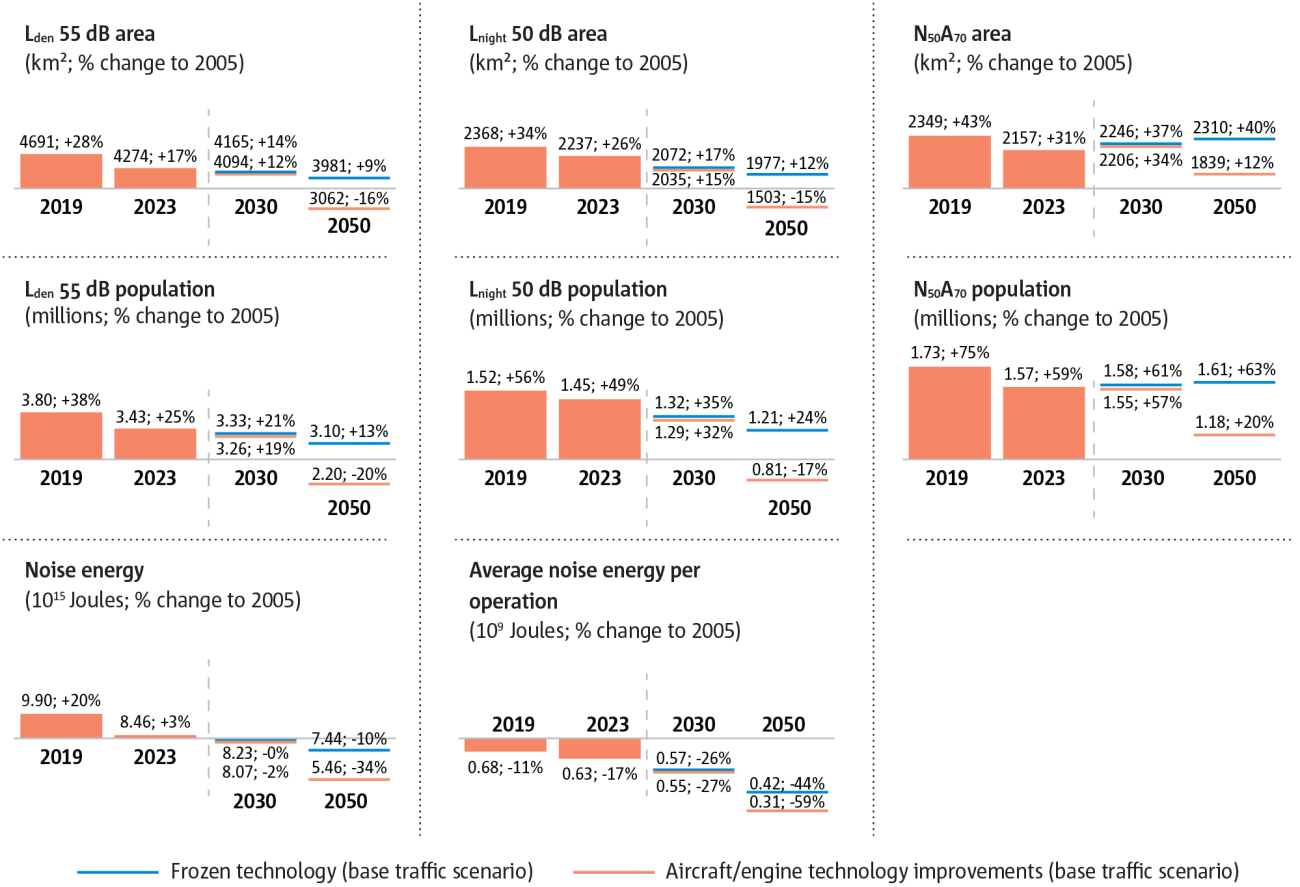
![Summary of noise indicators (% change to 2005)](/sites/default/files/styles/max_1300x1300/public/migrated_eaer_images/figure-1-9.png?itok=bw22Reff)
Figure 1.10(a)
Aircraft technology and ATM improvements could prevent further growth in European aviation’s CO2 emissions over the next decades
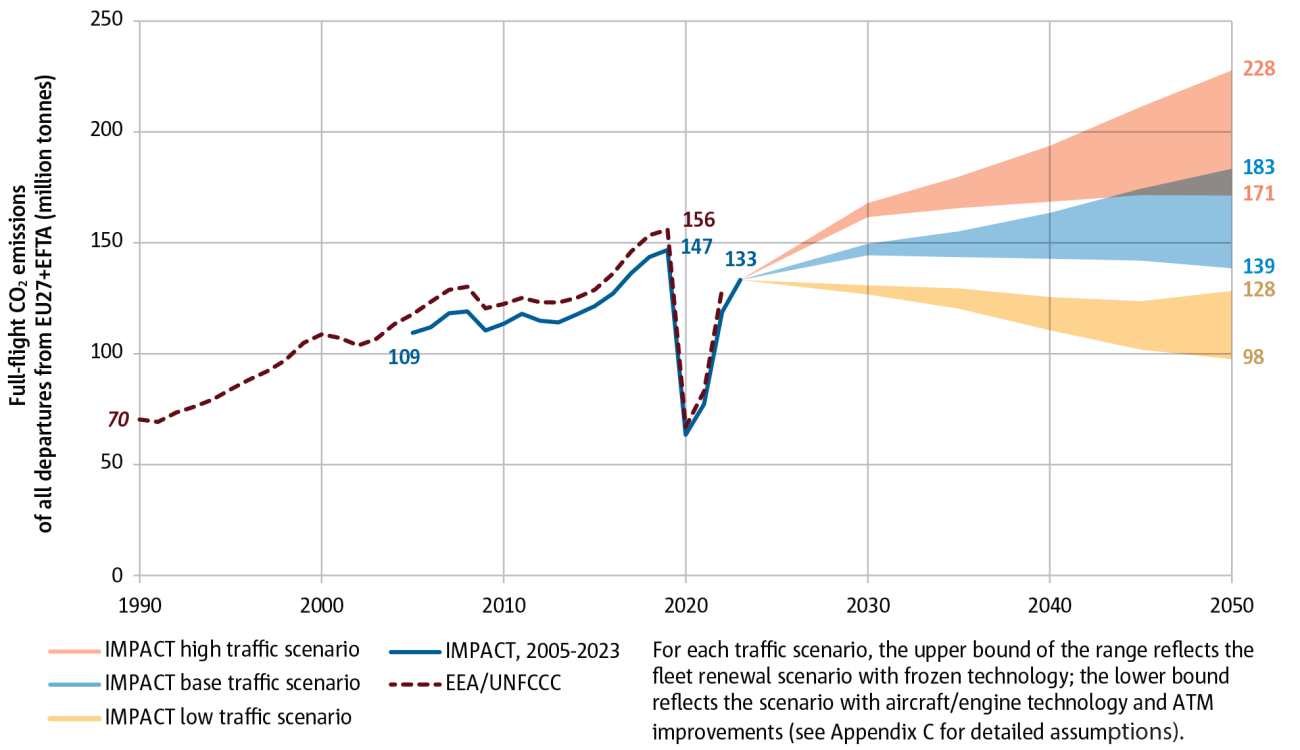
![Aircraft technology and ATM improvements could prevent further growth in European aviation’s CO<sub>2</sub> emissions over the next decades](/sites/default/files/styles/max_1300x1300/public/migrated_eaer_images/figure-1-10a.png?itok=dswZSICP)
Figure 1.10(b)
Meeting the SAF supply mandate would cut net CO2 emissions by at least 47% in 2050
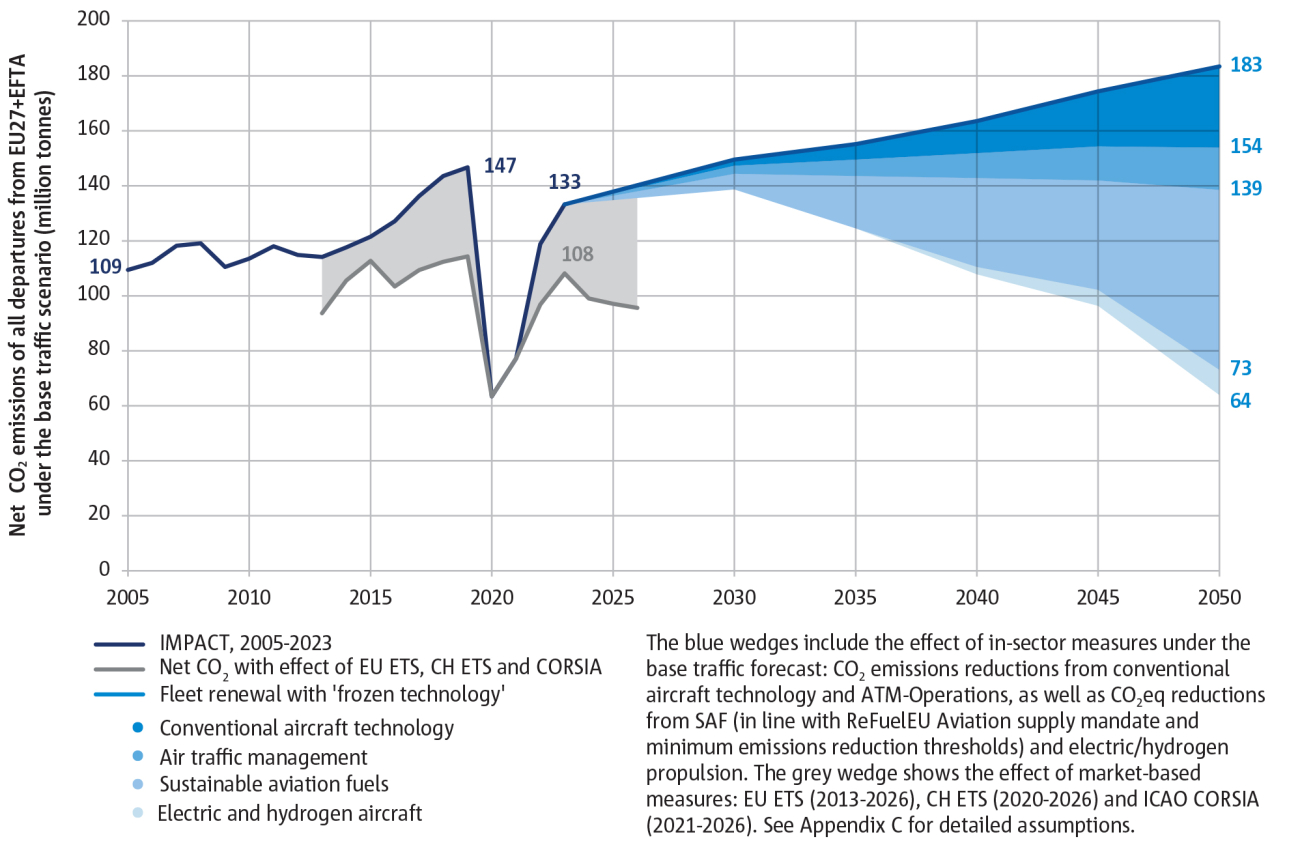
![Meeting the SAF supply mandate would cut net CO<sub>2</sub> emissions by at least 47% in 2050](/sites/default/files/styles/max_1300x1300/public/migrated_eaer_images/figure-1-10b.png?itok=aTJ9J9LB)
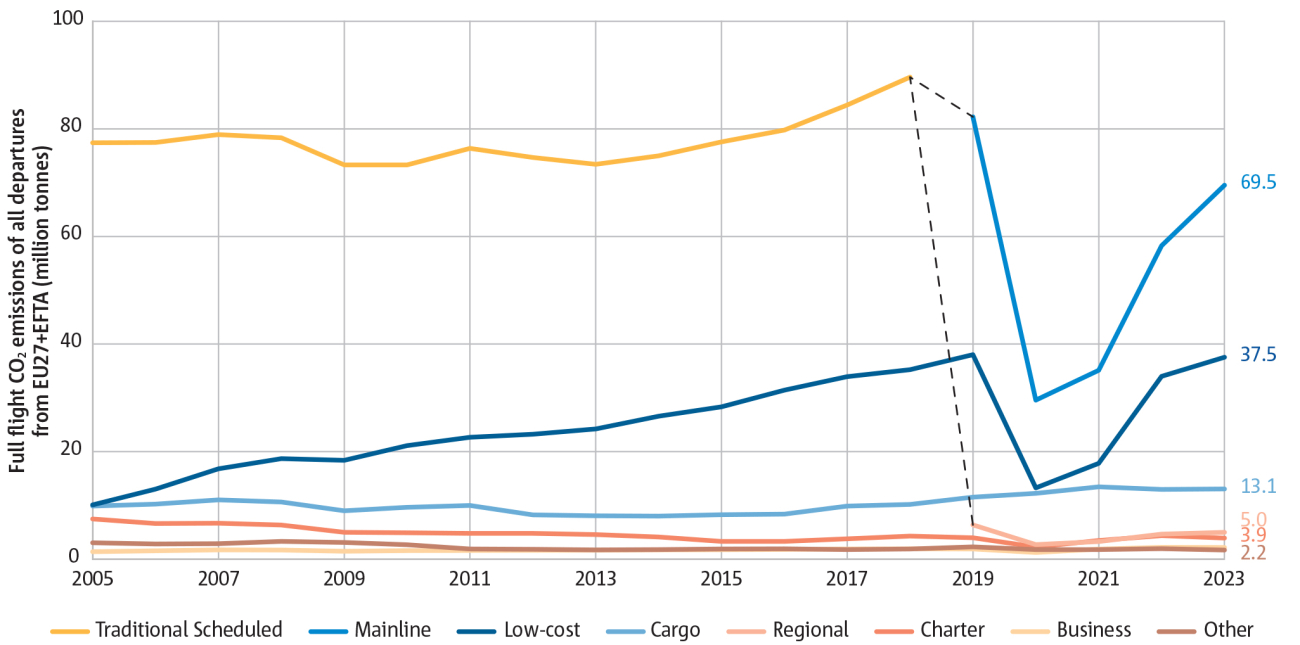
Figure 1.11
Mainline and low-cost operators account for 80% of total CO2 emissions
![Mainline and low-cost operators account for 80% of total CO<sub>2</sub> emissions](/sites/default/files/styles/max_1300x1300/public/migrated_eaer_images/figure-1-11.png?itok=GEyIhgd_)
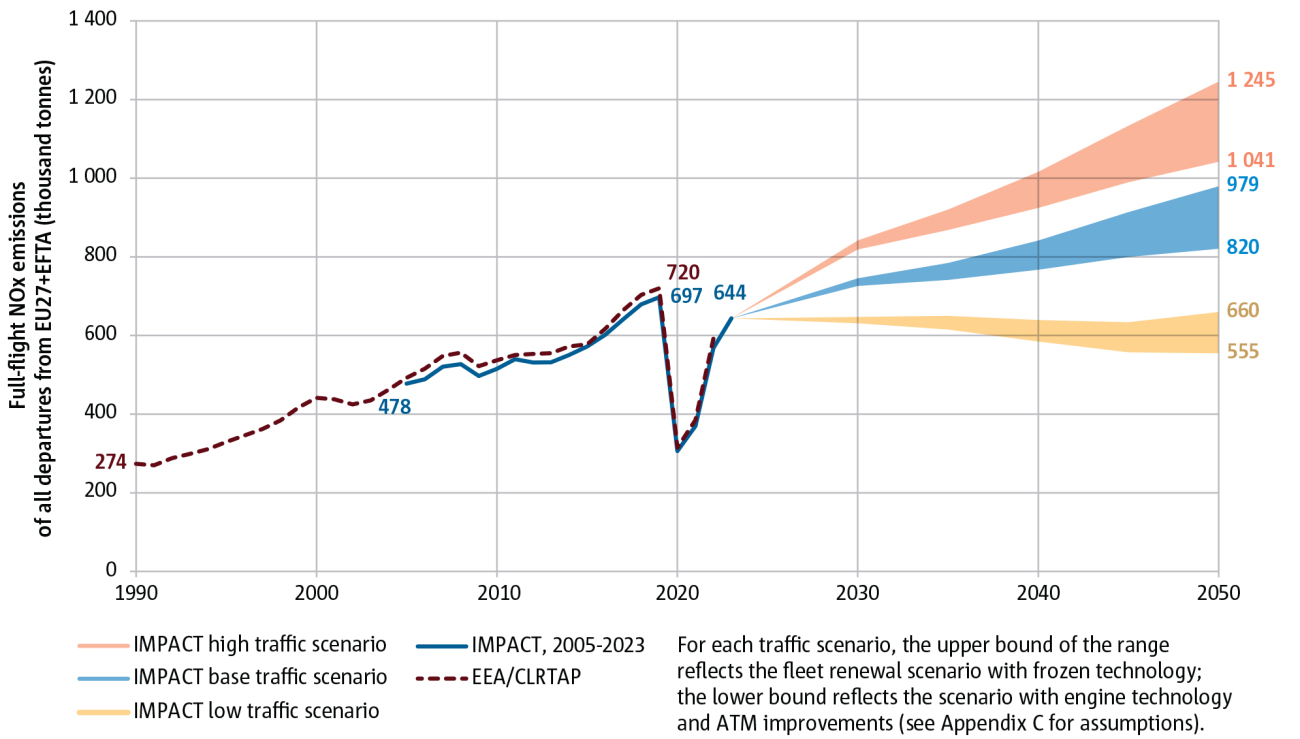
Figure 1.12
NOX emissions may continue to grow with traffic
![NO<sub>X<sub> emissions may continue to grow with traffic](/sites/default/files/styles/max_1300x1300/public/migrated_eaer_images/figure-1-12.png?itok=kvUe6U64)
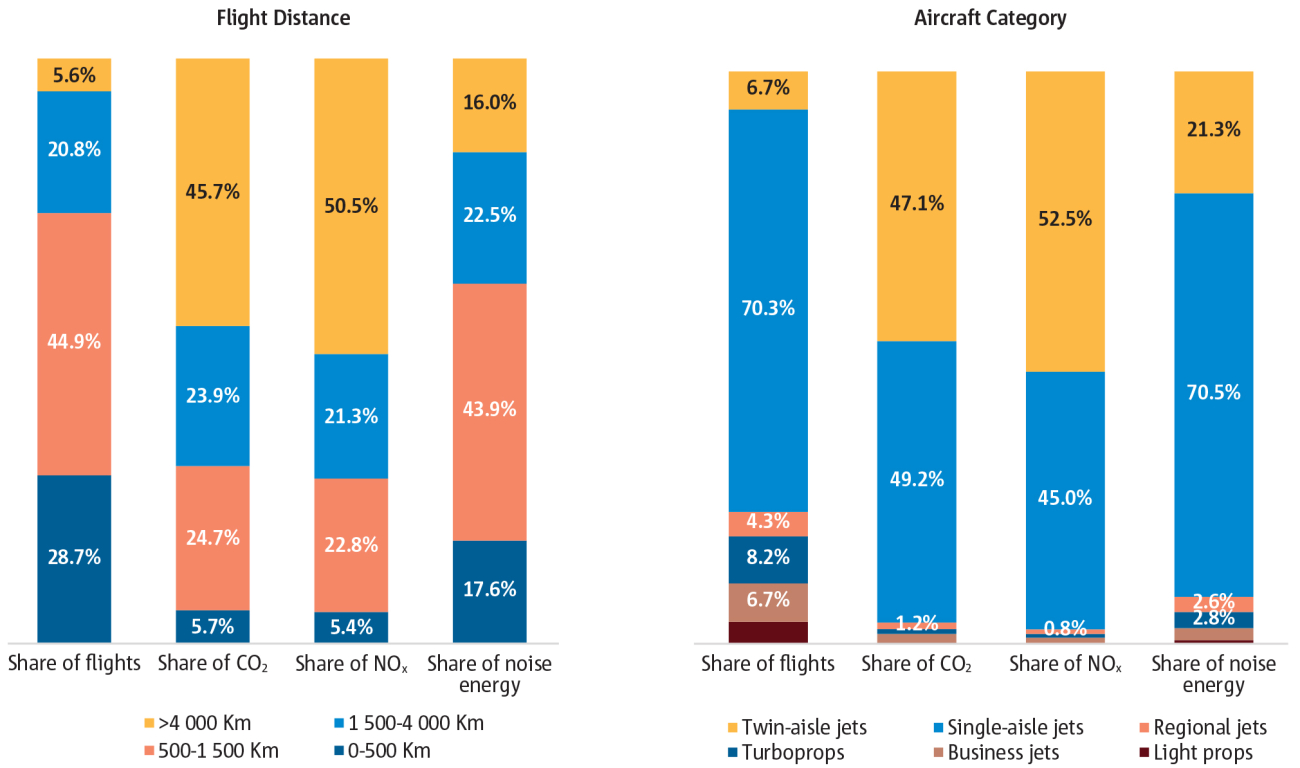
Figure 1.13
Single-aisle and twin-aisle jets generated over 90% of noise and emissions in 2023
![Single-aisle and twin-aisle jets generated over 90% of noise and emissions in 2023](/sites/default/files/styles/max_1300x1300/public/migrated_eaer_images/figure-1-13.png?itok=0nVl3uQO)
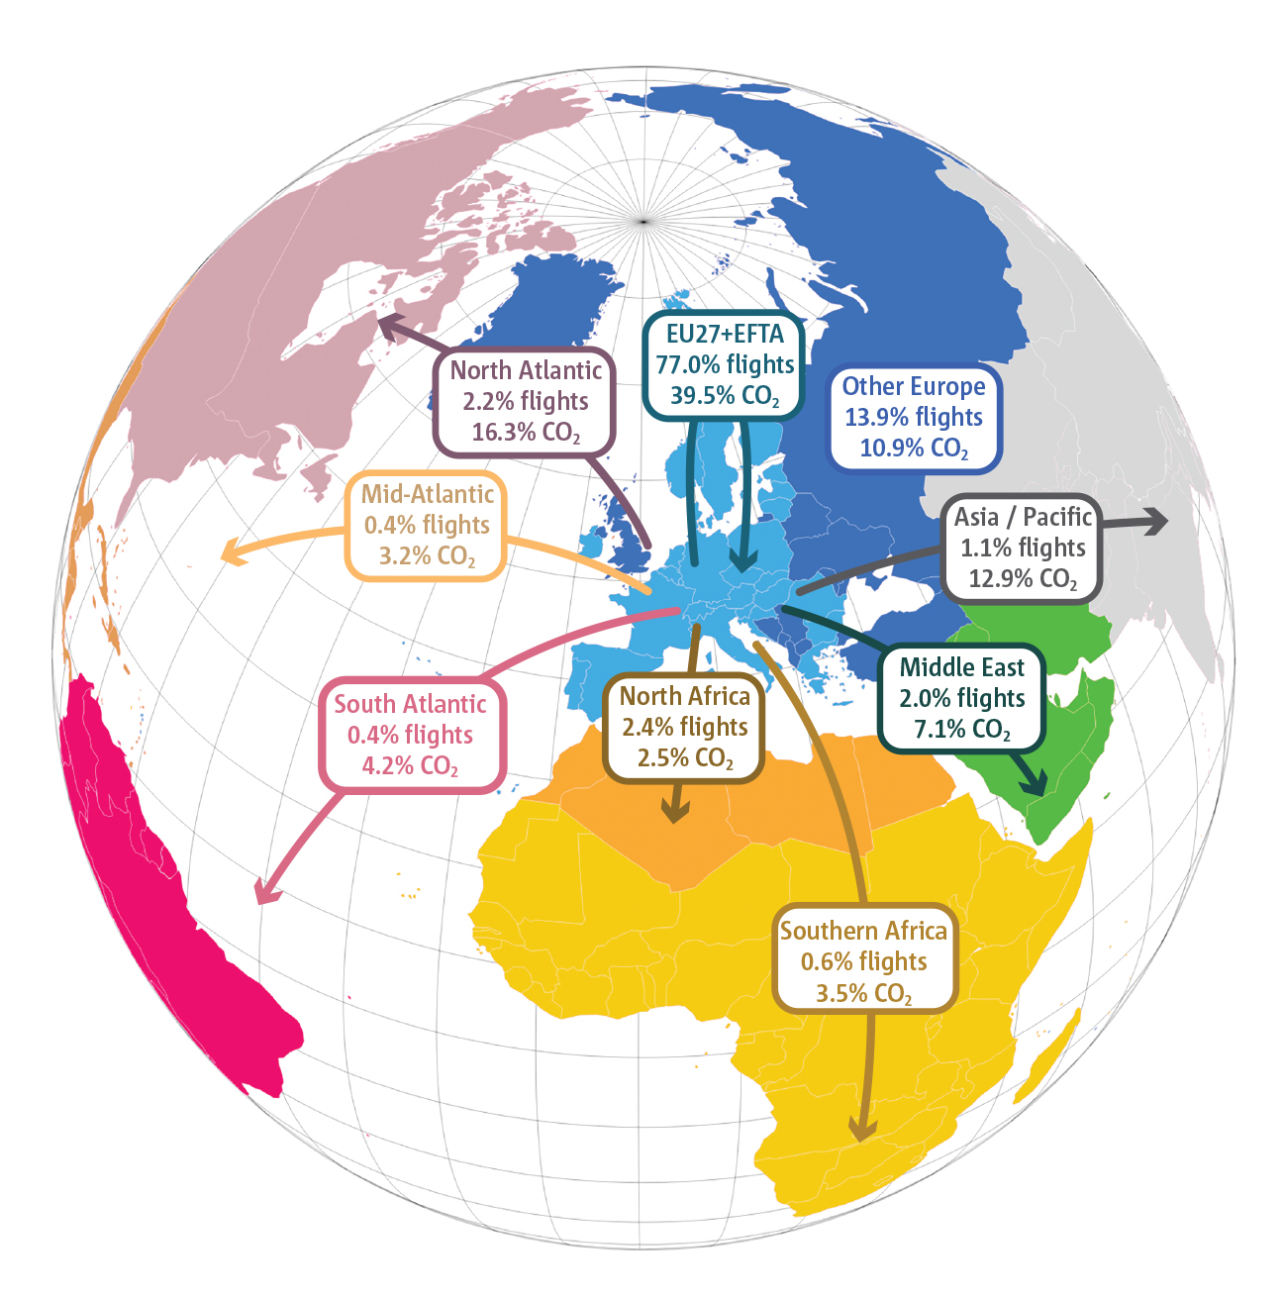
Figure 1.14
Extra-EU27+EFTA flights represented 23% of departures and 61% of CO2 emissions in 2023
![Extra-EU27+EFTA flights represented 23% of departures and 61% of CO<sub>2</sub> emissions in 2023](/sites/default/files/styles/max_1300x1300/public/migrated_eaer_images/figure-1-14.png?itok=r2OqZr9D)
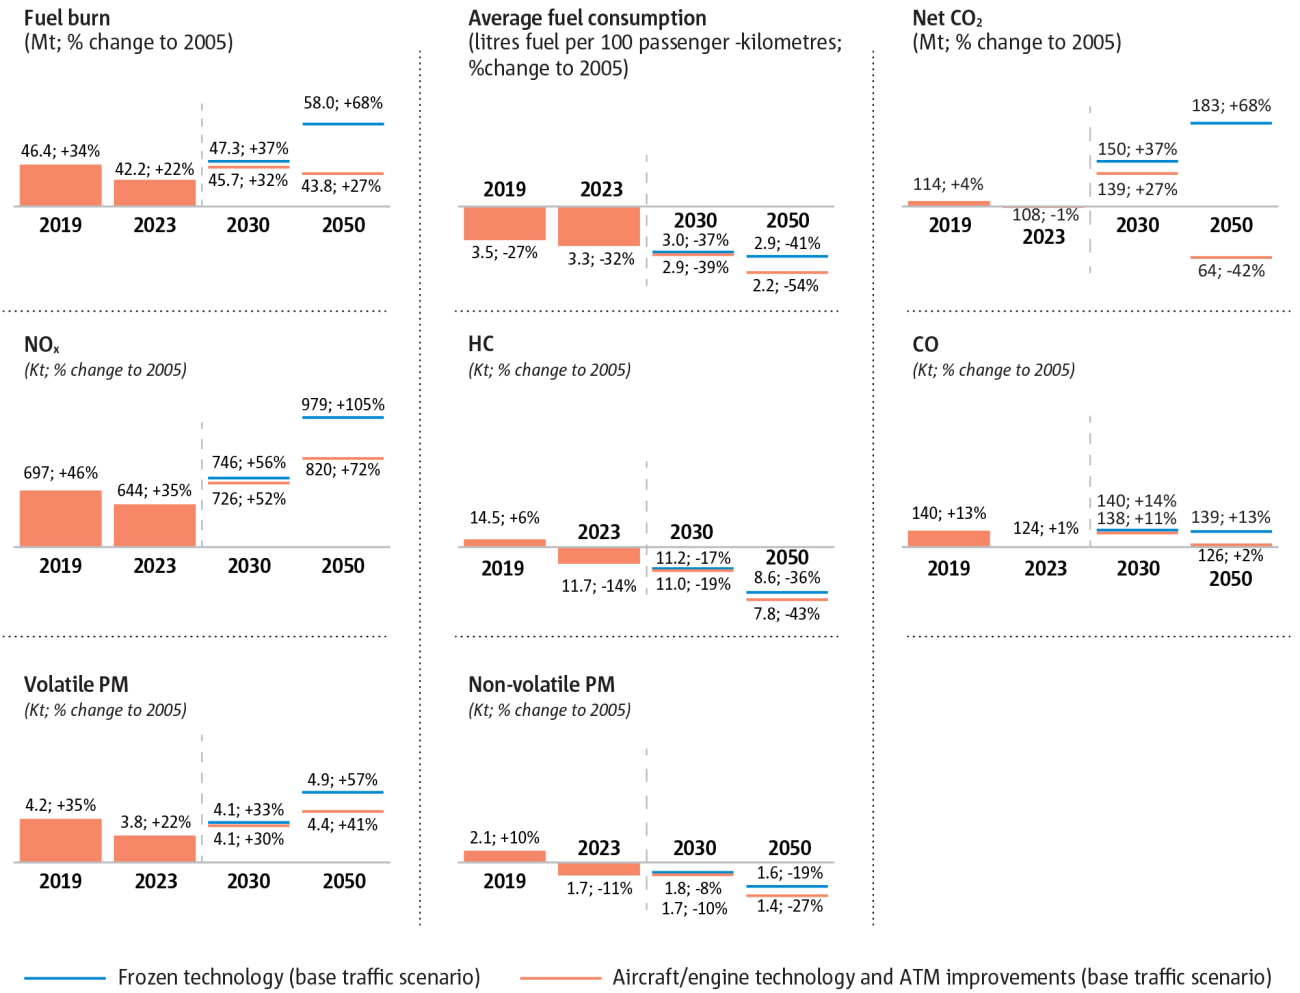
Figure 1.15
Summary of full-flight emission indicators (% change to 2005)
![Summary of full-flight emission indicators (% change to 2005)](/sites/default/files/styles/max_1300x1300/public/migrated_eaer_images/figure-1-15.png?itok=2T5yERdj)
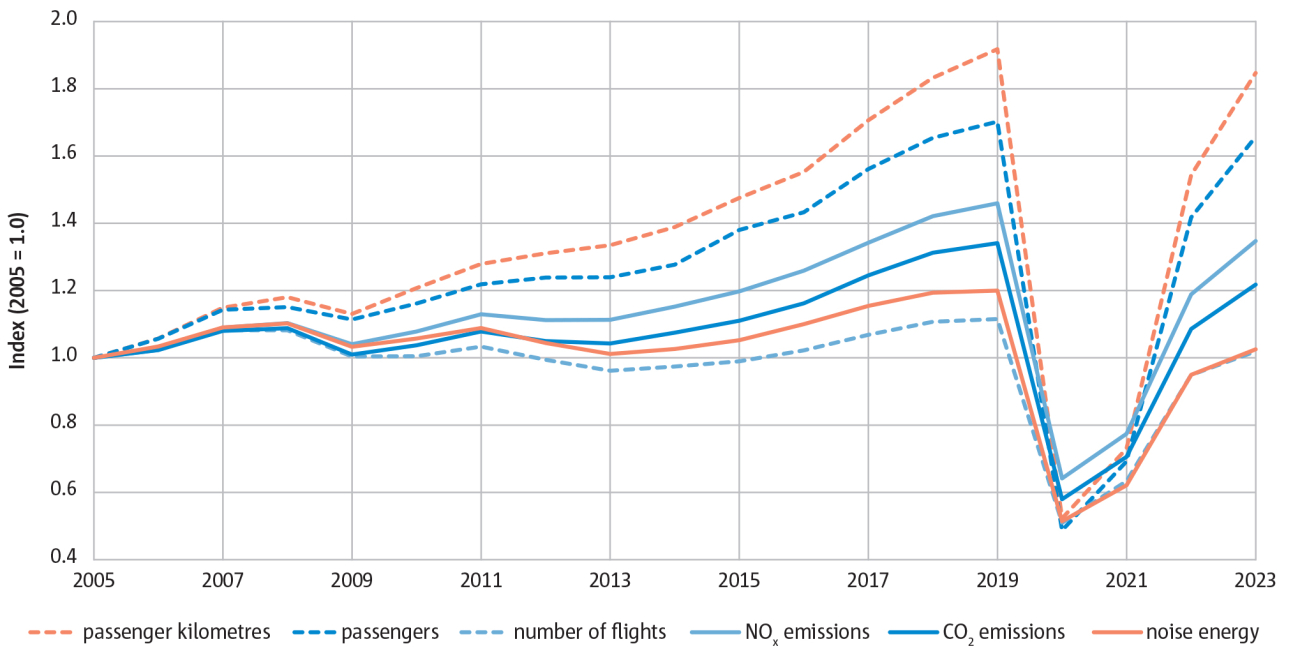
Figure 1.16
CO2 emissions continue to grow faster than noise energy, but slower than NOX
![CO<sub>2</sub> emissions continue to grow faster than noise energy, but slower than NO<sub>X</sub>](/sites/default/files/styles/max_1300x1300/public/migrated_eaer_images/figure-1-16.png?itok=oC6pEITU)