Figure 4.1
KEA horizontal en-route flight inefficiency and targets for 2014 to 2029
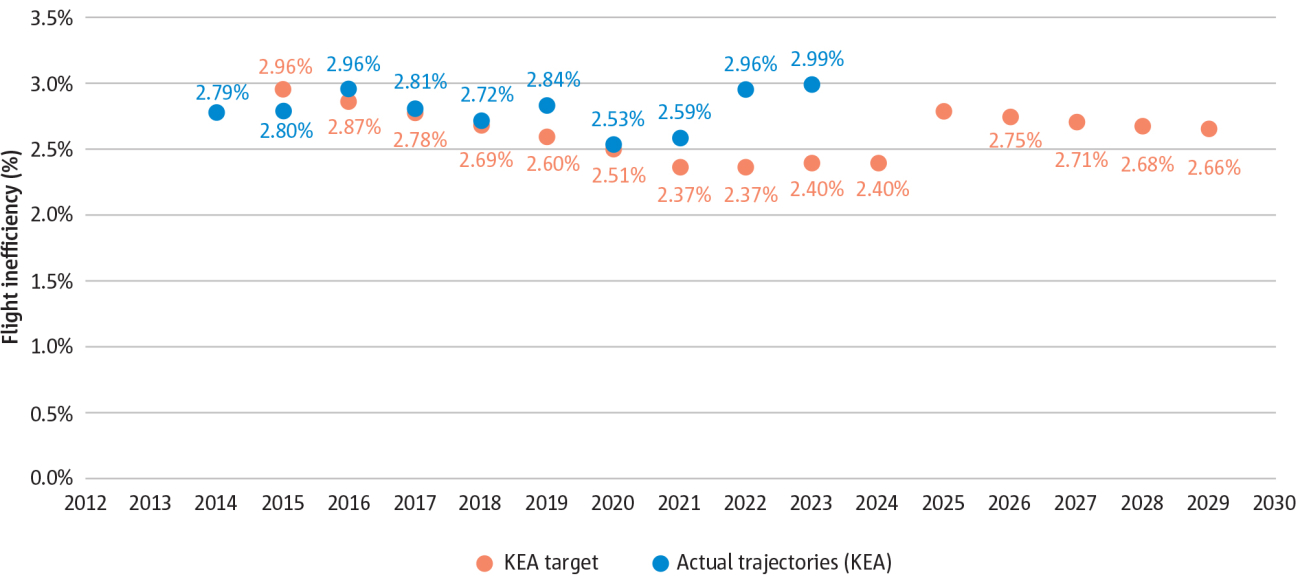
Figure 4.2
KEP horizontal en-route flight inefficiency and KES/SCR for 2014 to 2023
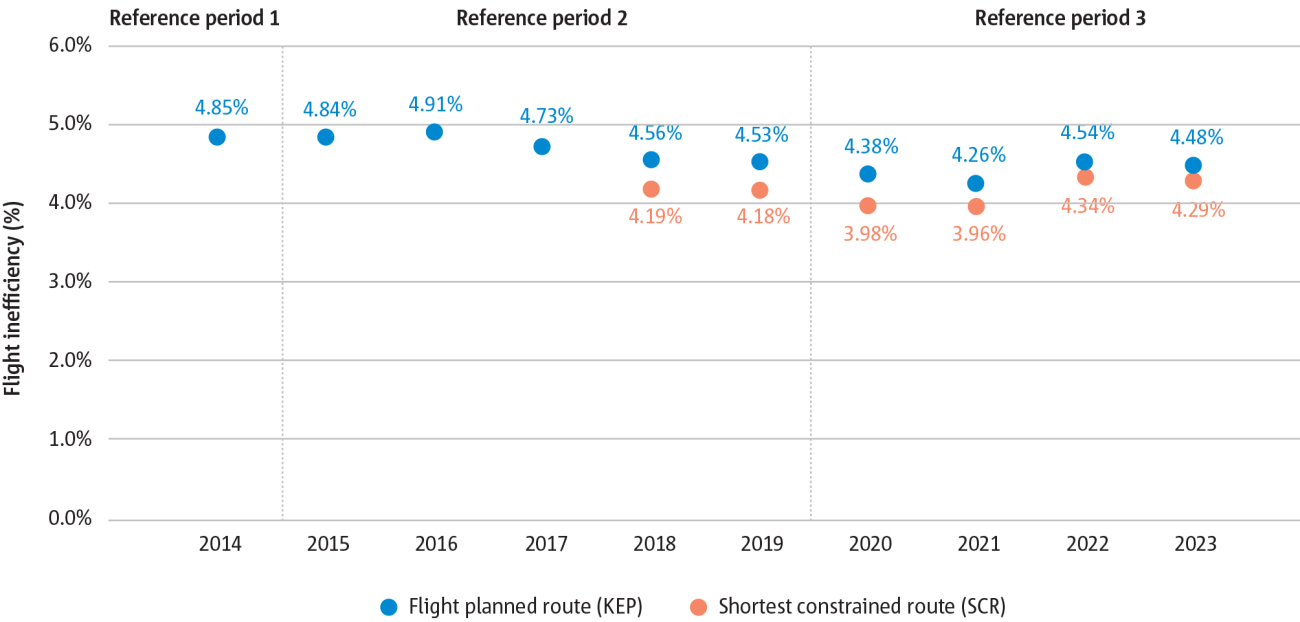
Figure 4.3
CDO vertical flight efficiency indicator for 2023
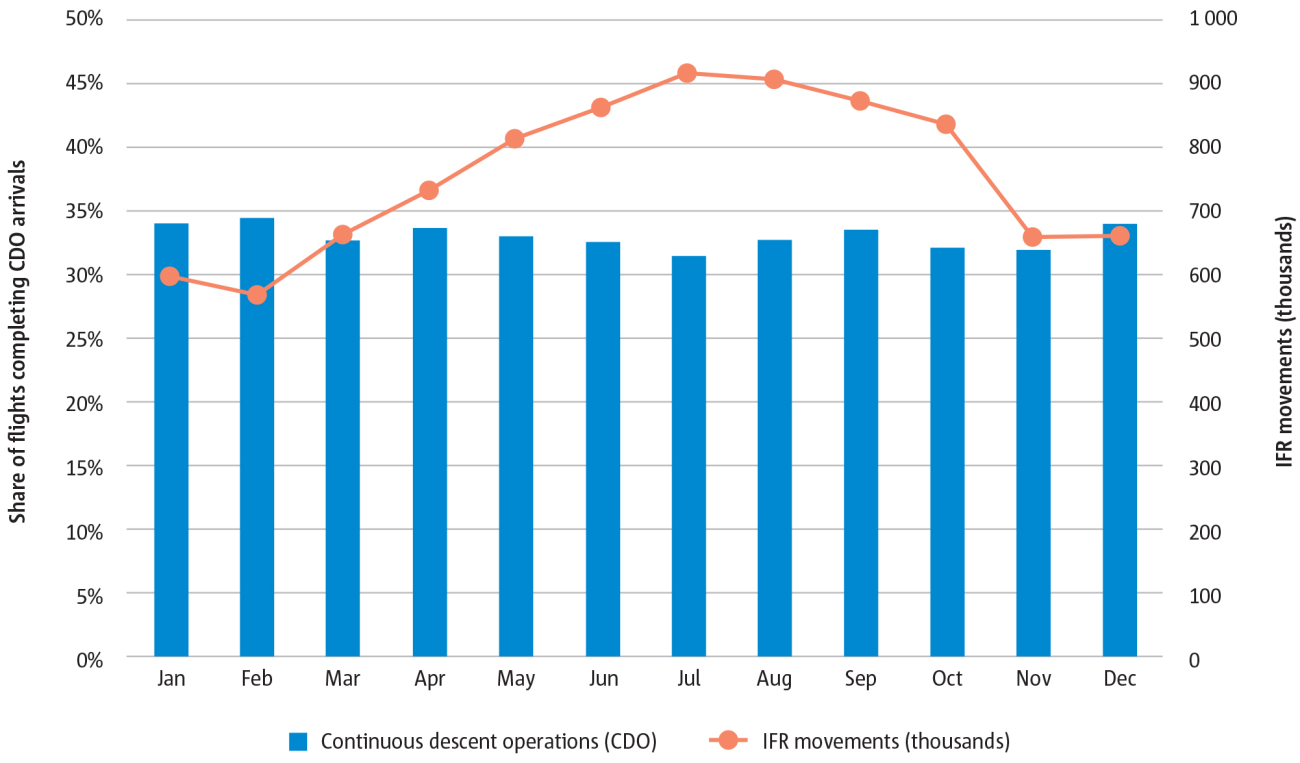
Figure 4.4
Average additional ASMA and taxi-out times for the busiest EU27+EFTA 40 airports in terms of flight movements
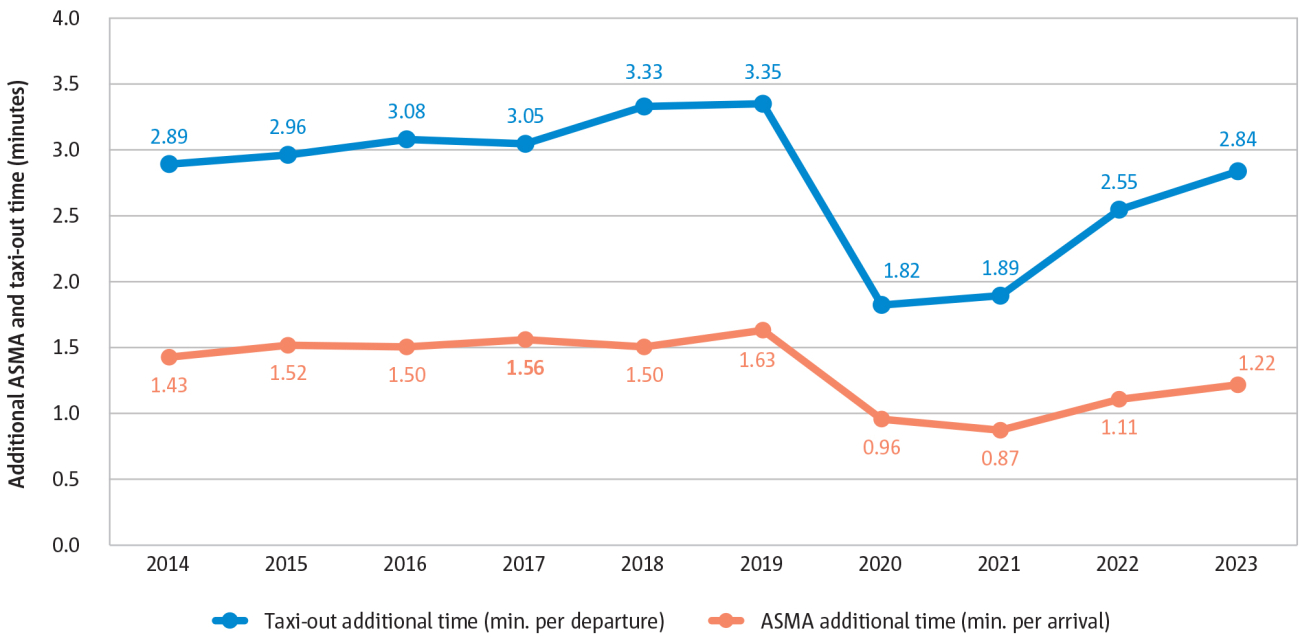
Figure 4.5
ATM related inefficiencies on the arrival flow (AMSA) at the 40 busiest EU27+EFTA airports (2019-2023)
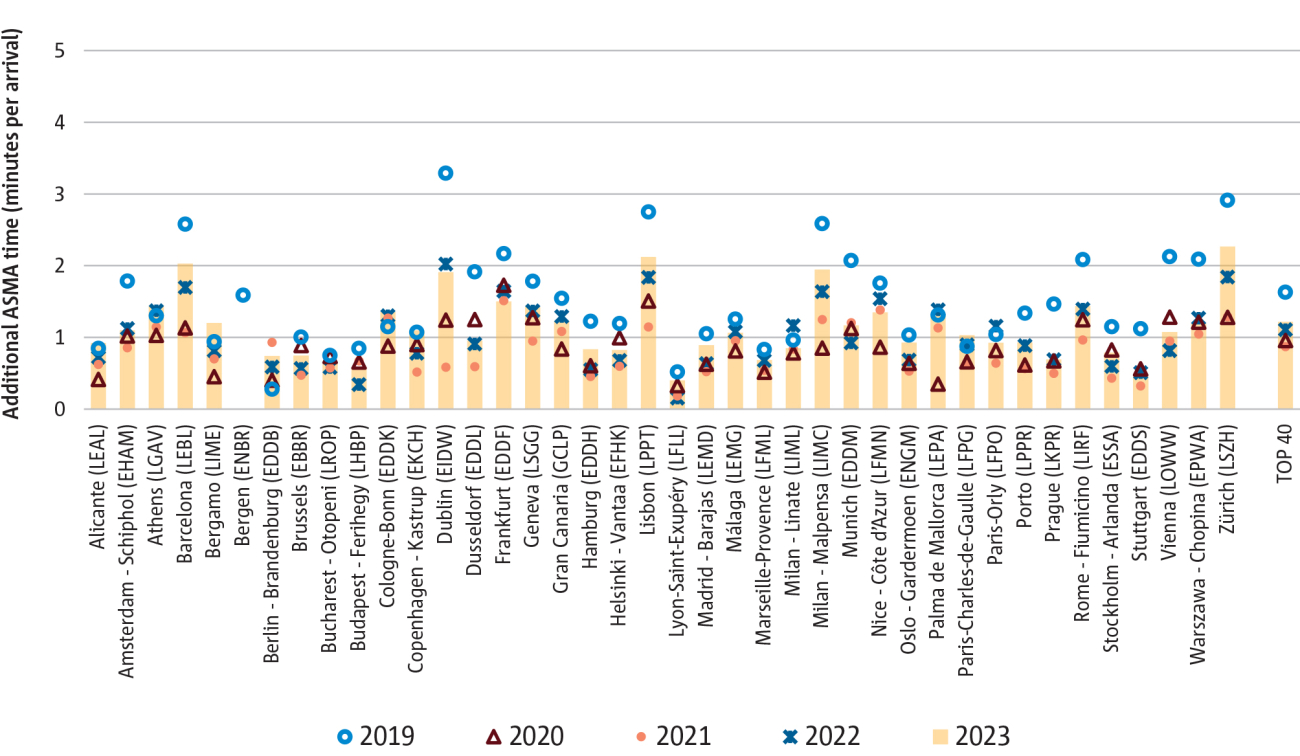
Figure 4.6
Total CO2 emissions by flight phase within the EUROCONTROL area during 2023
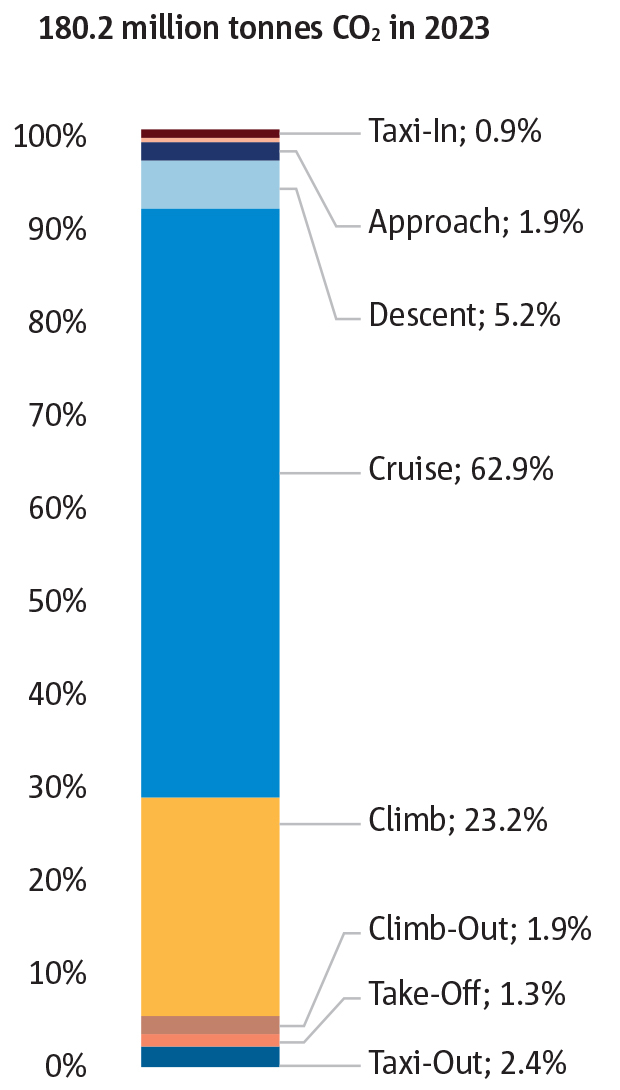
Figure 4.7
Cumulative distribution of departure and fuel burn in 2023
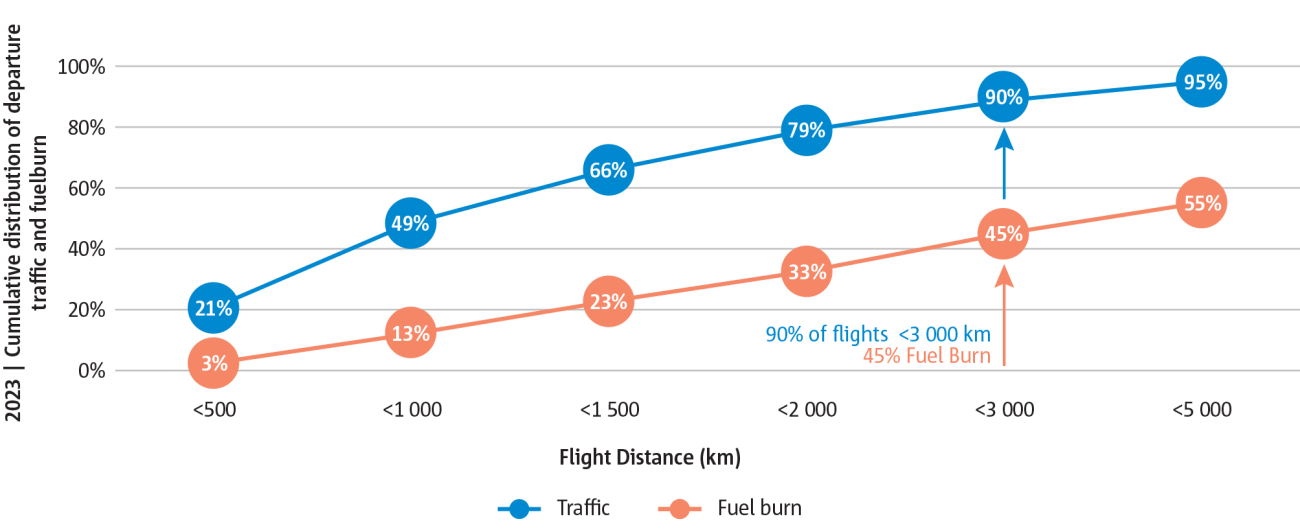
Figure 4.8
Increased fuel consumption as a function of the distance before the optimum Top-of-Descent that the descent phase is started, without intermediate level-offs

Figure 4.9
Overview of Common Projects 1 (CP1) ATM Functionalities
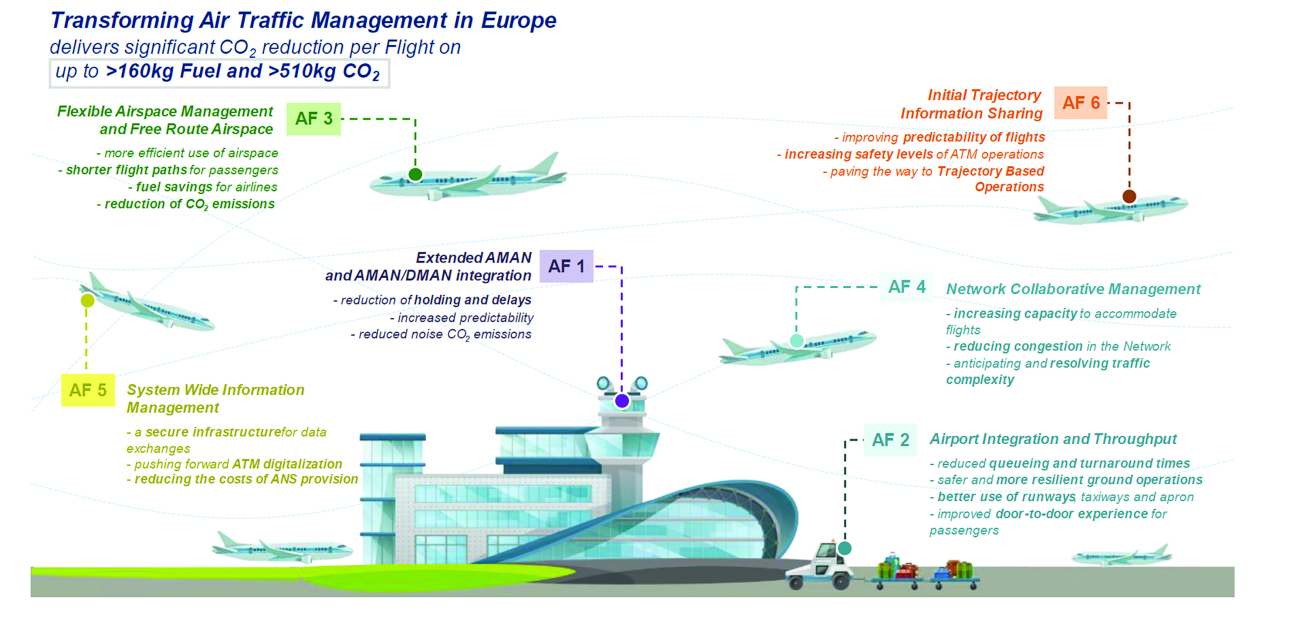
Table 4.1
CO2 savings per Common Project 1 ATM Functionality
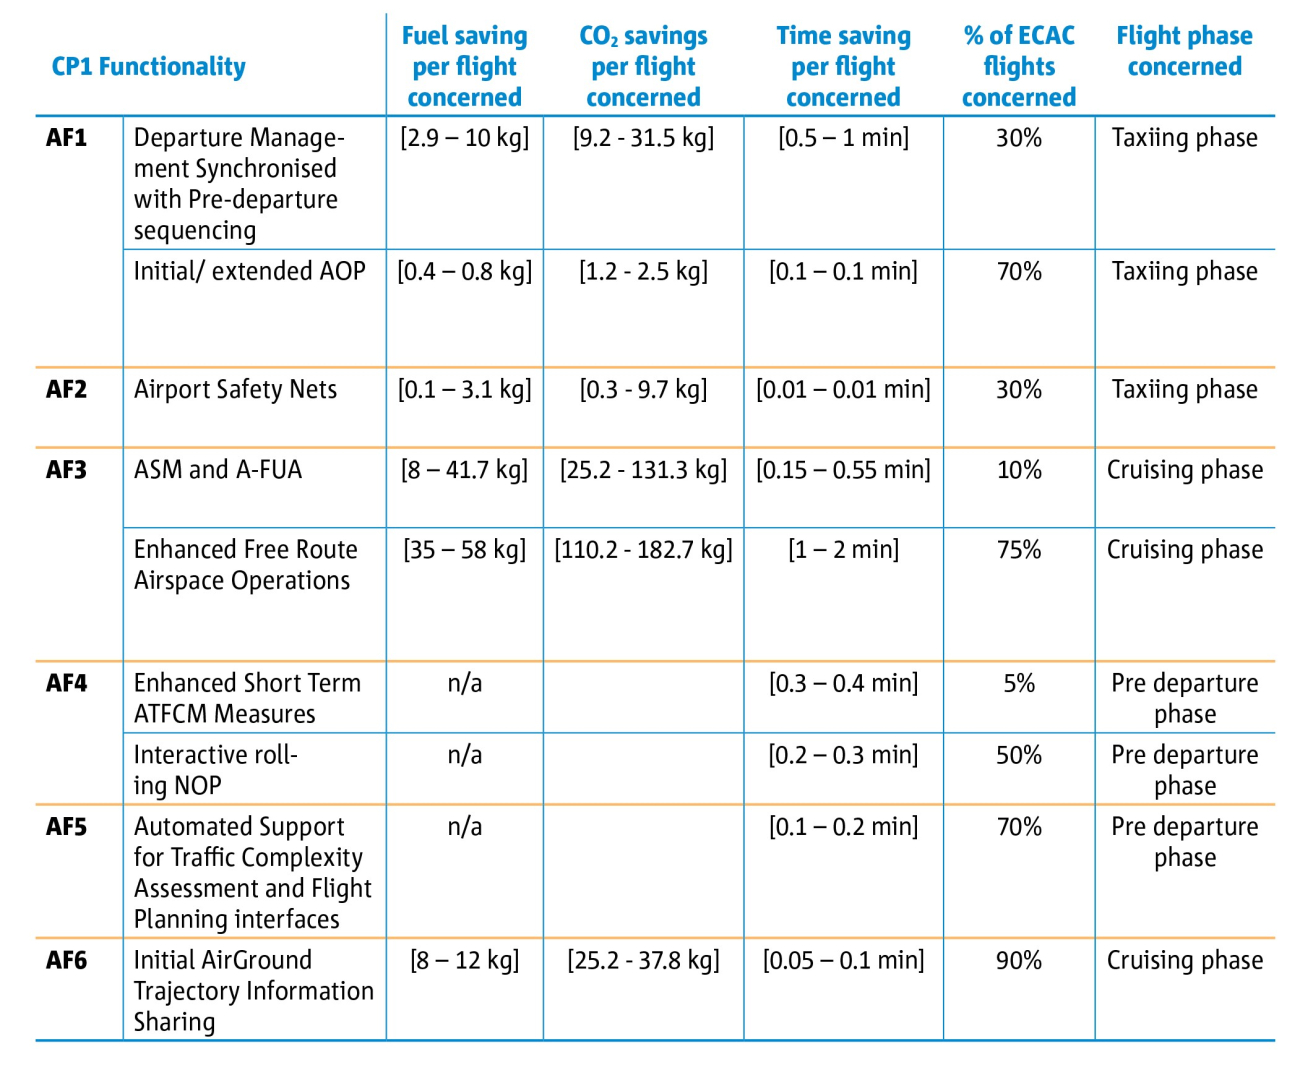
Table 4.2
Benefit-Cost Ratio and CO2 savings from CP1 AF implementation
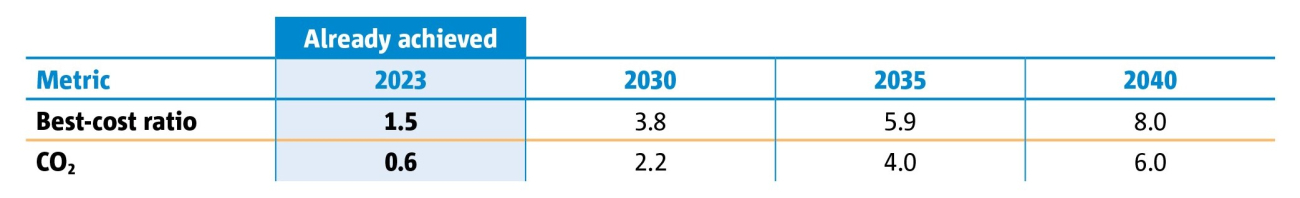
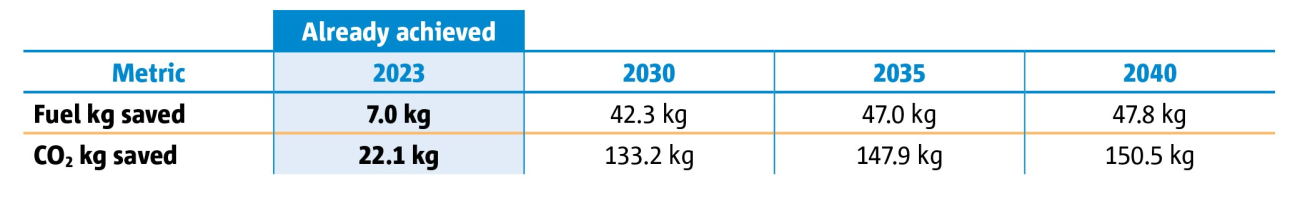
Table 4.3
Savings in fuel and CO2 emissions per flight in 2023 and the forecast out to 2040