Table 6.1
ReFuelEU Aviation Regulation fuel categories
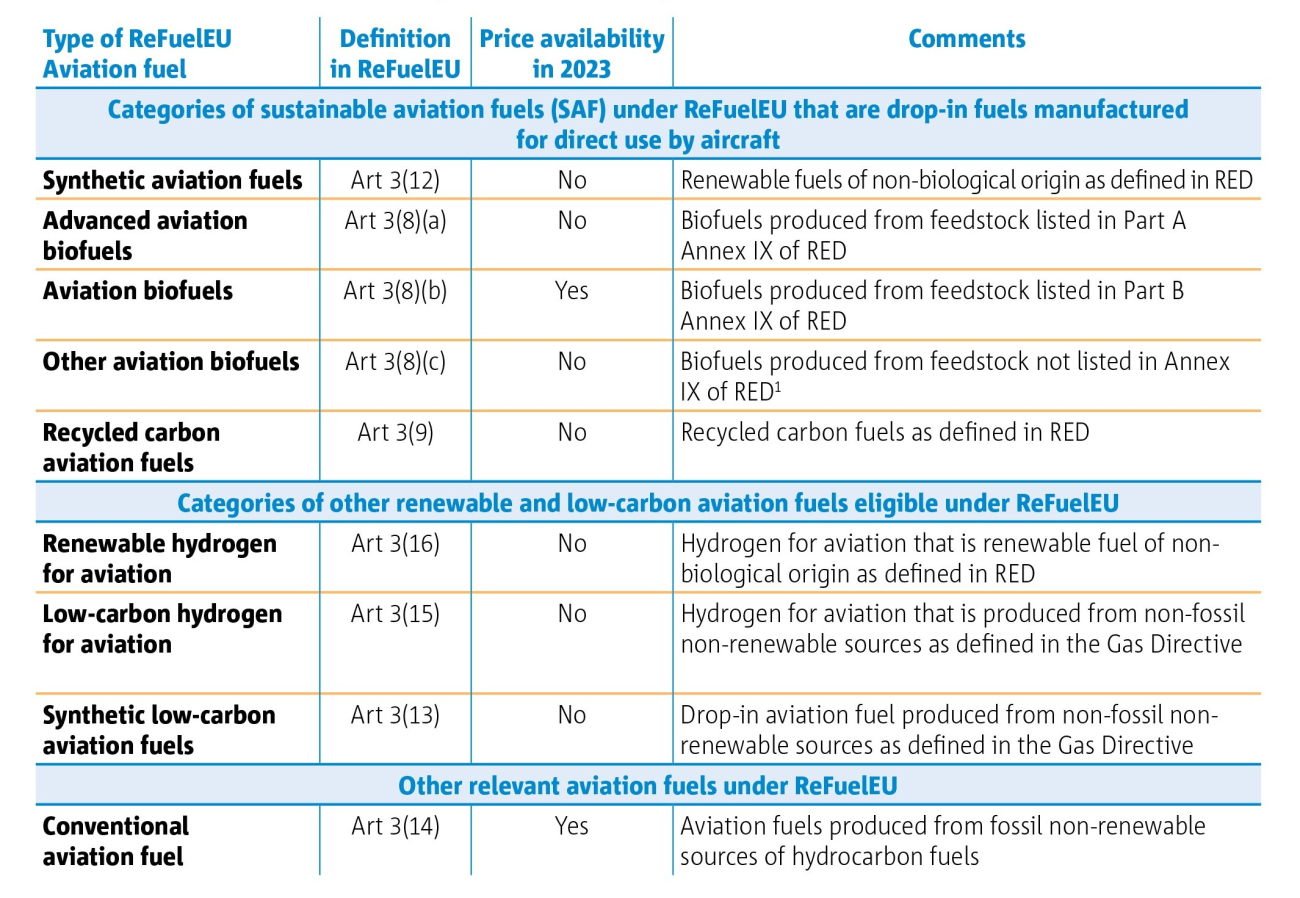
1 …and except for those produced from food and feed crops, intermediate crops, palm fatty acid distillate and palm and soyderived materials, and soap stock and its derivatives.
Table 6.2
Drop-in SAF qualified production pathways
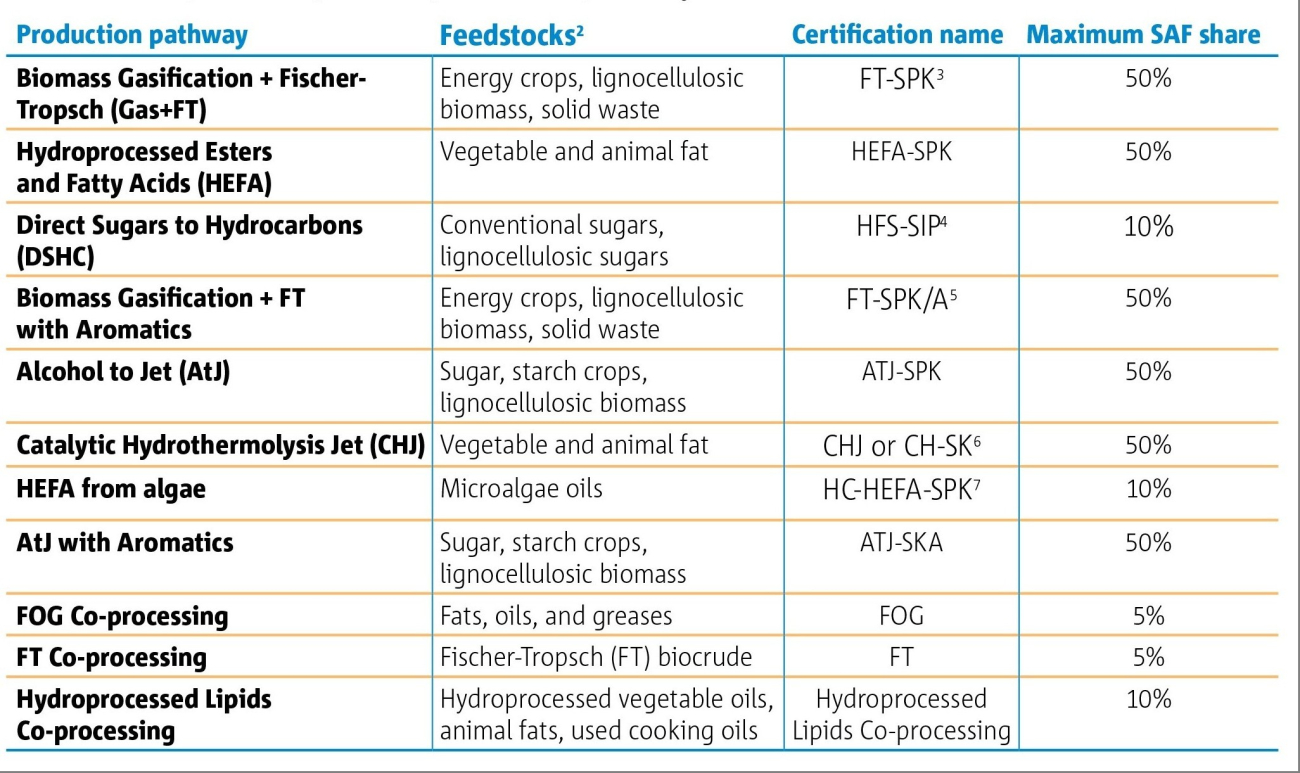
Figure 6.1
Main SAF production pathways with similar building blocks
![Main SAF production pathways with similar building blocks [8]](/sites/default/files/styles/max_1300x1300/public/migrated_eaer_images/figure-6-1.png?itok=ABK7PTbs)
Table 6.3
SAF sustainability criteria
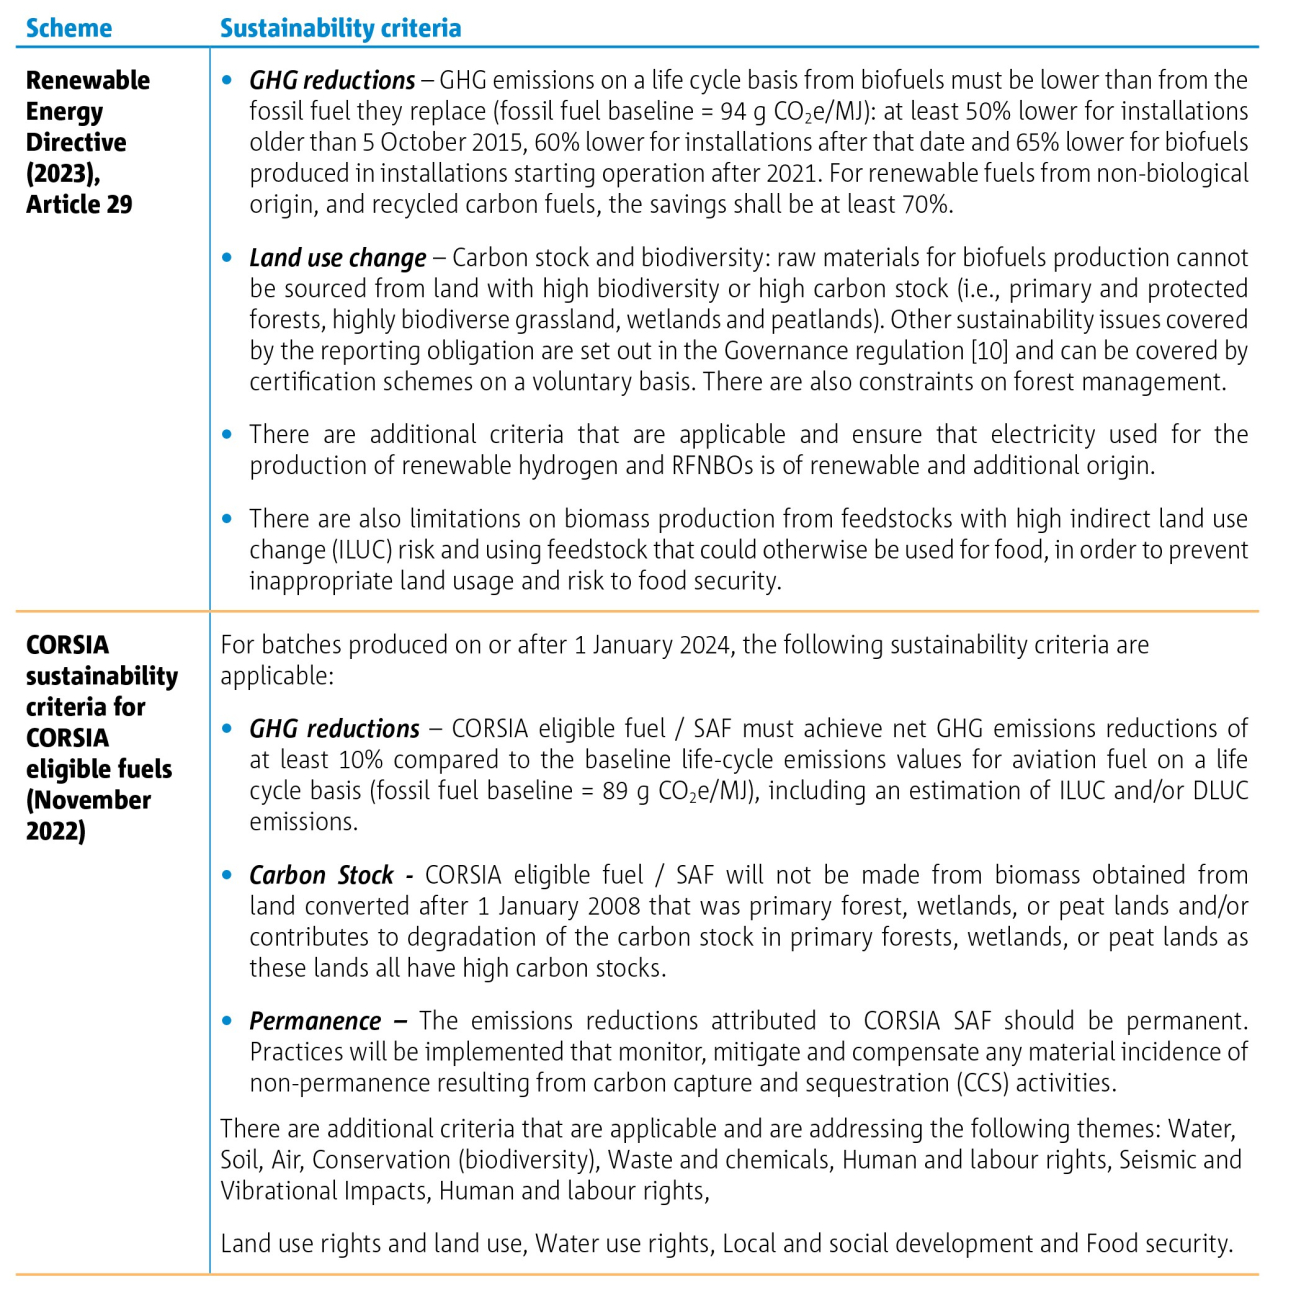
Figure 6.2
Components of typical well-to-wing LCA for biofuel-based jet fuel

Figure 6.3
LCA emissions for CORSIA eligible SAF pathways and feedstock compared to CORSIA fossil fuel reference value (89 g CO2e/MJ)
![LCA emissions for CORSIA eligible SAF pathways and feedstock compared to CORSIA fossil fuel reference value (89 g CO<sub>2</sub>e/MJ) [19]](/sites/default/files/styles/max_1300x1300/public/migrated_eaer_images/figure-6-3.png?itok=51D3Sphi)
Figure 6.4
Projected EU+EFTA SAF facilities in 2030 under the Optimistic scenario
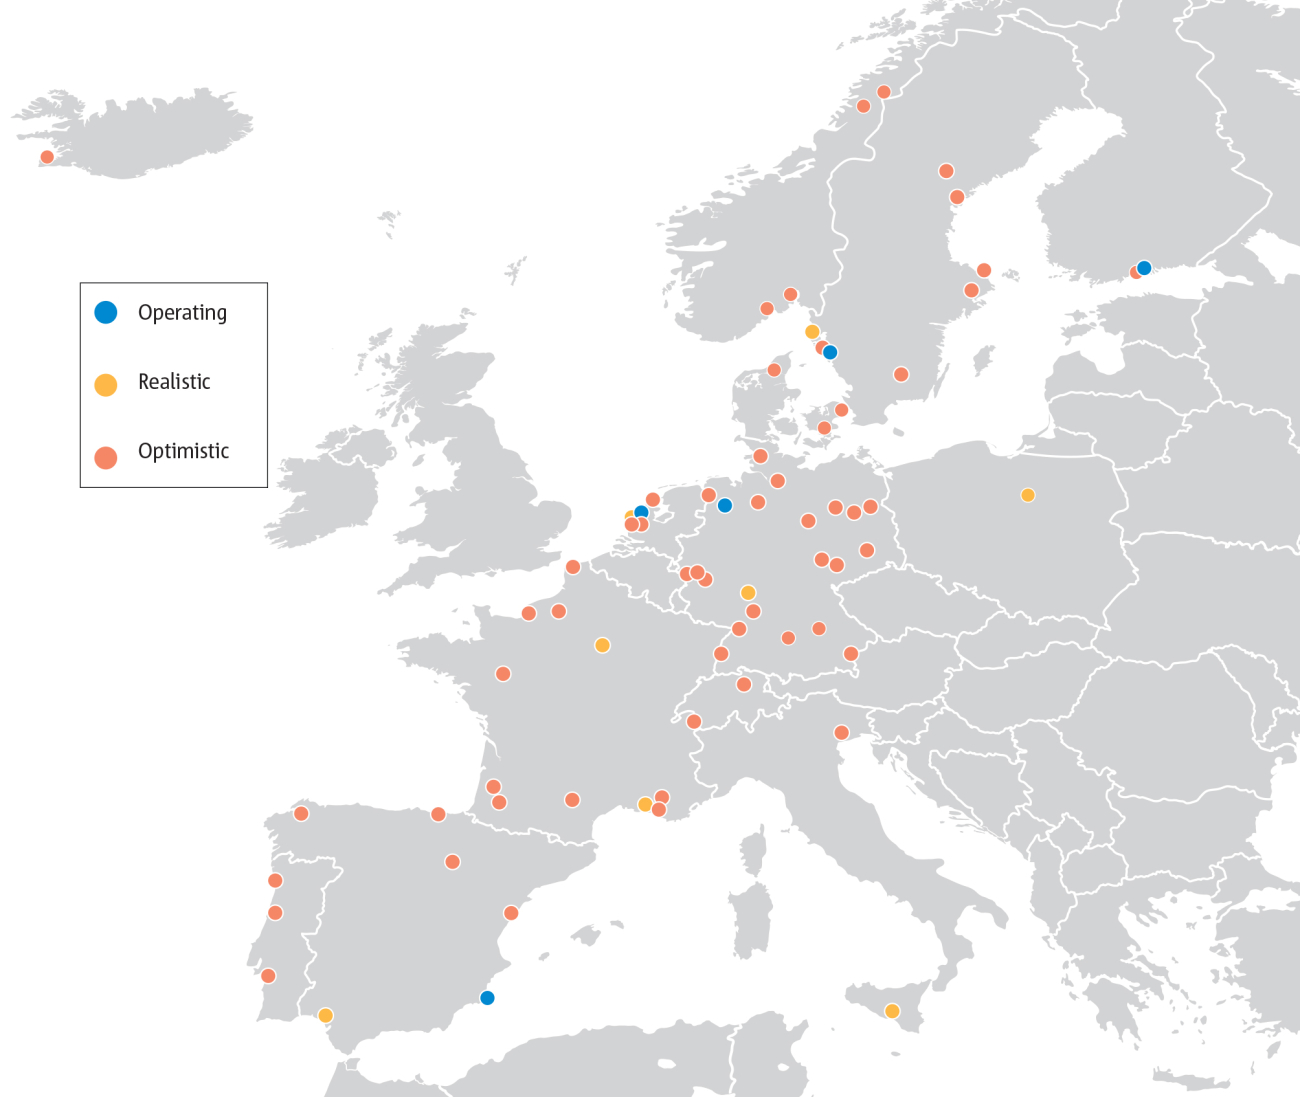
Figure 6.5
Projected EU+EFTA SAF capacity in 2030 by scenario
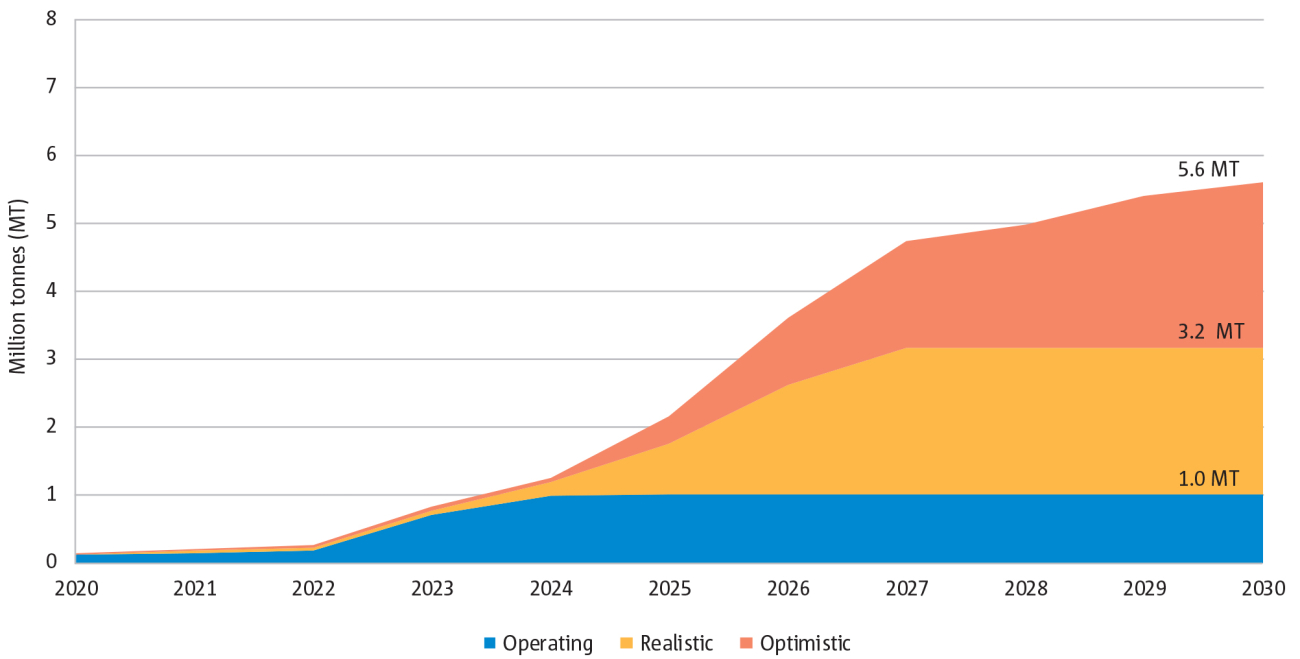
Figure 6.6
% CO2e emissions reductions from the uptake of SAF under ReFuelEU Aviation scenarios
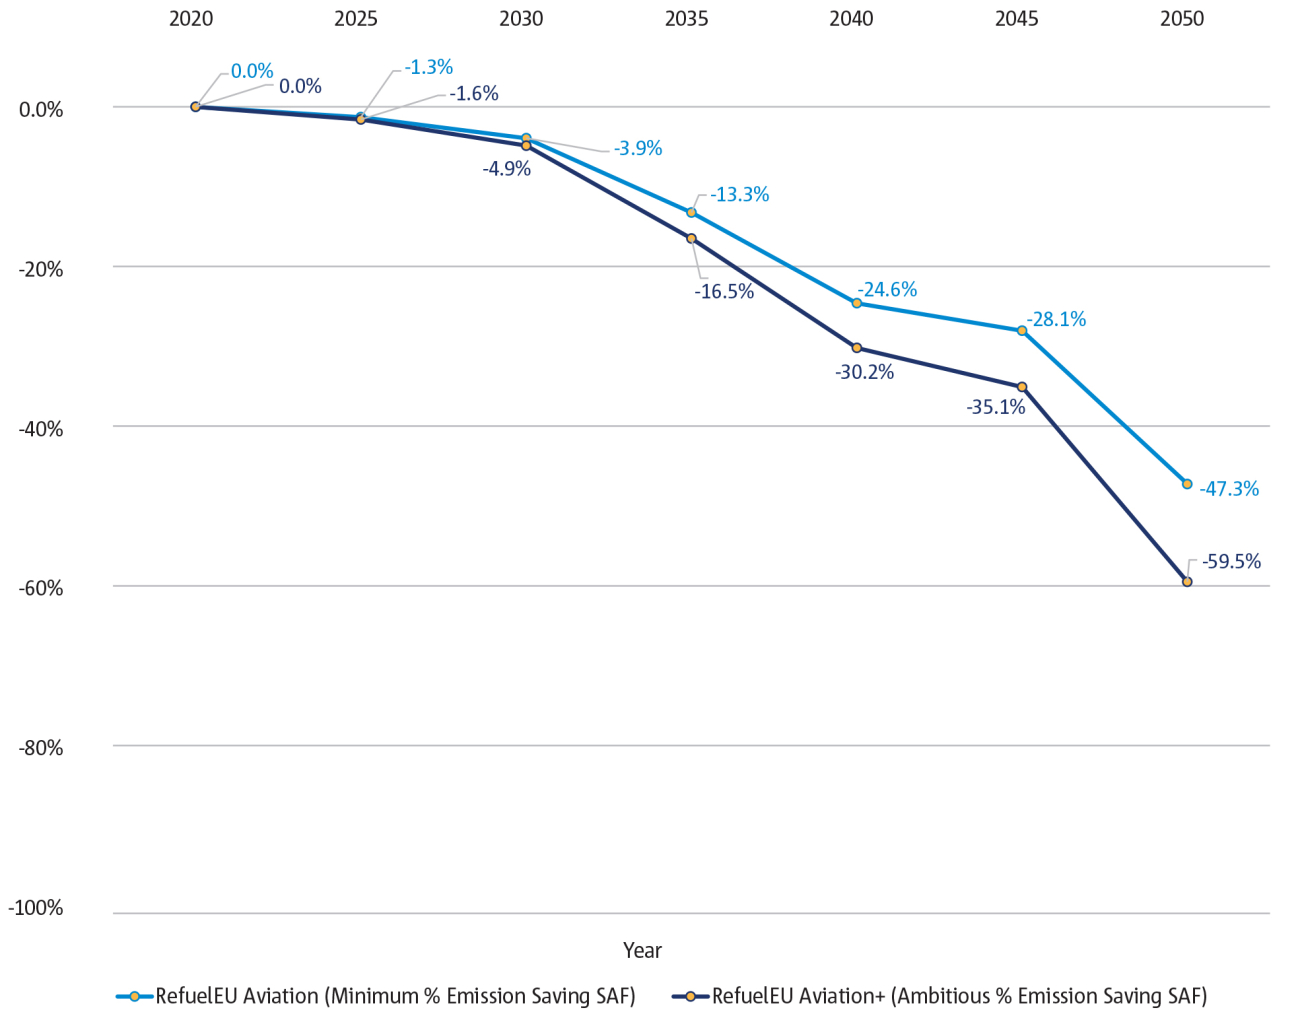
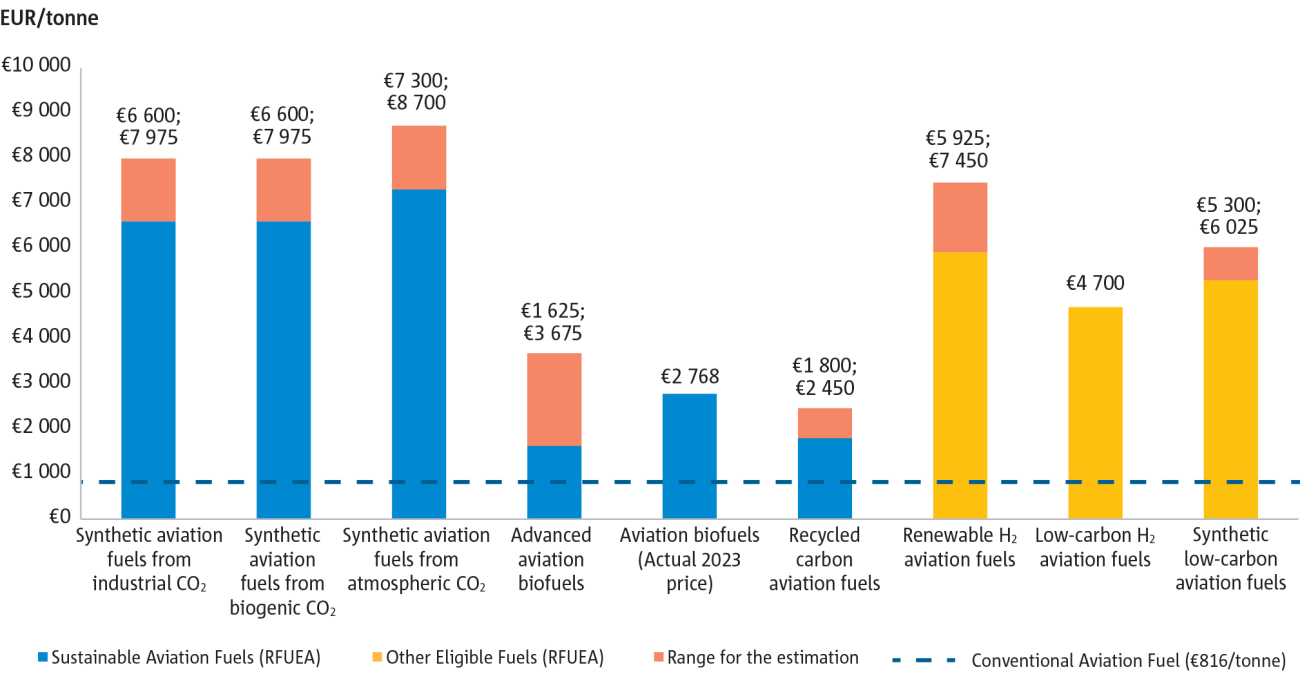
Figure 6.7
Estimated prices and production costs in 2023 for ReFuelEU Aviation eligible fuels
